To review this section, click on the video below.
RATE OF CHANGE
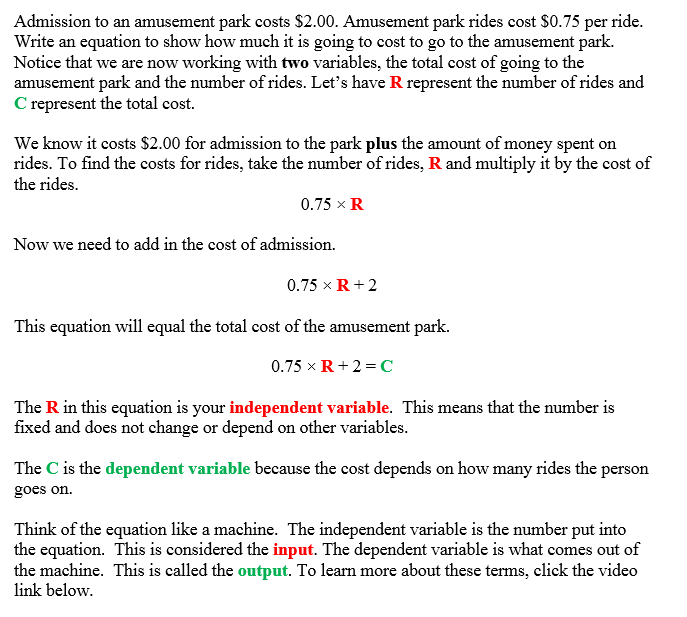
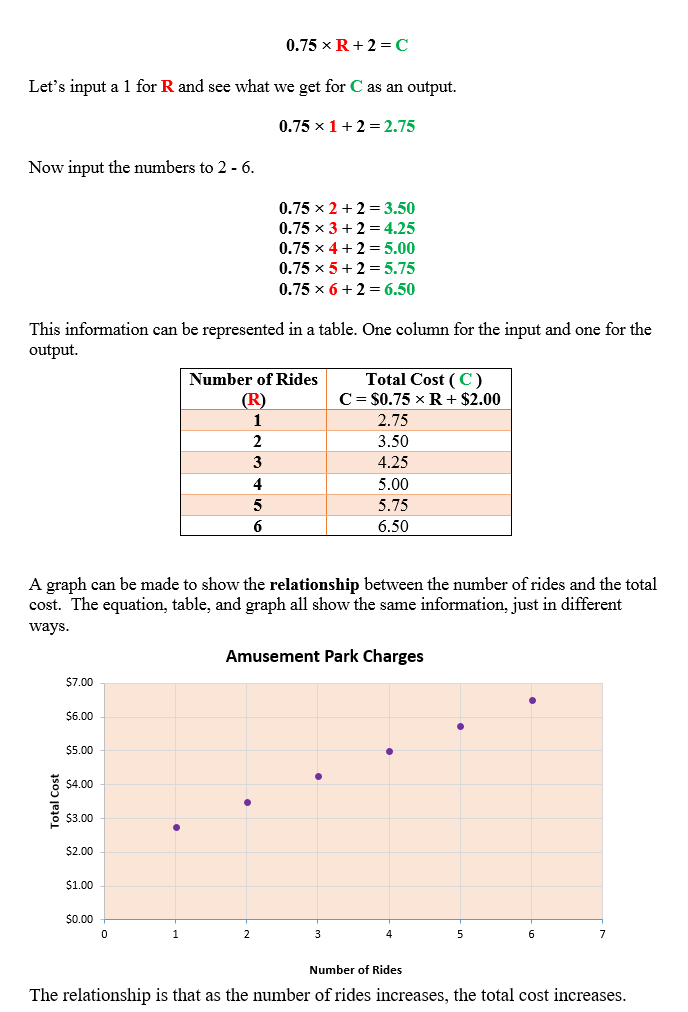
Tables and graphs may be used to show relationships between two variables. Equations can be used to represent the relationship between two variables. For example, the equation, d = 65t could represent the amount of miles traveled (d) by a car on the Interstate which would be related to the time (t) the car traveled. We'll examine some equations, tables, and graphs that show relationships between two variables.
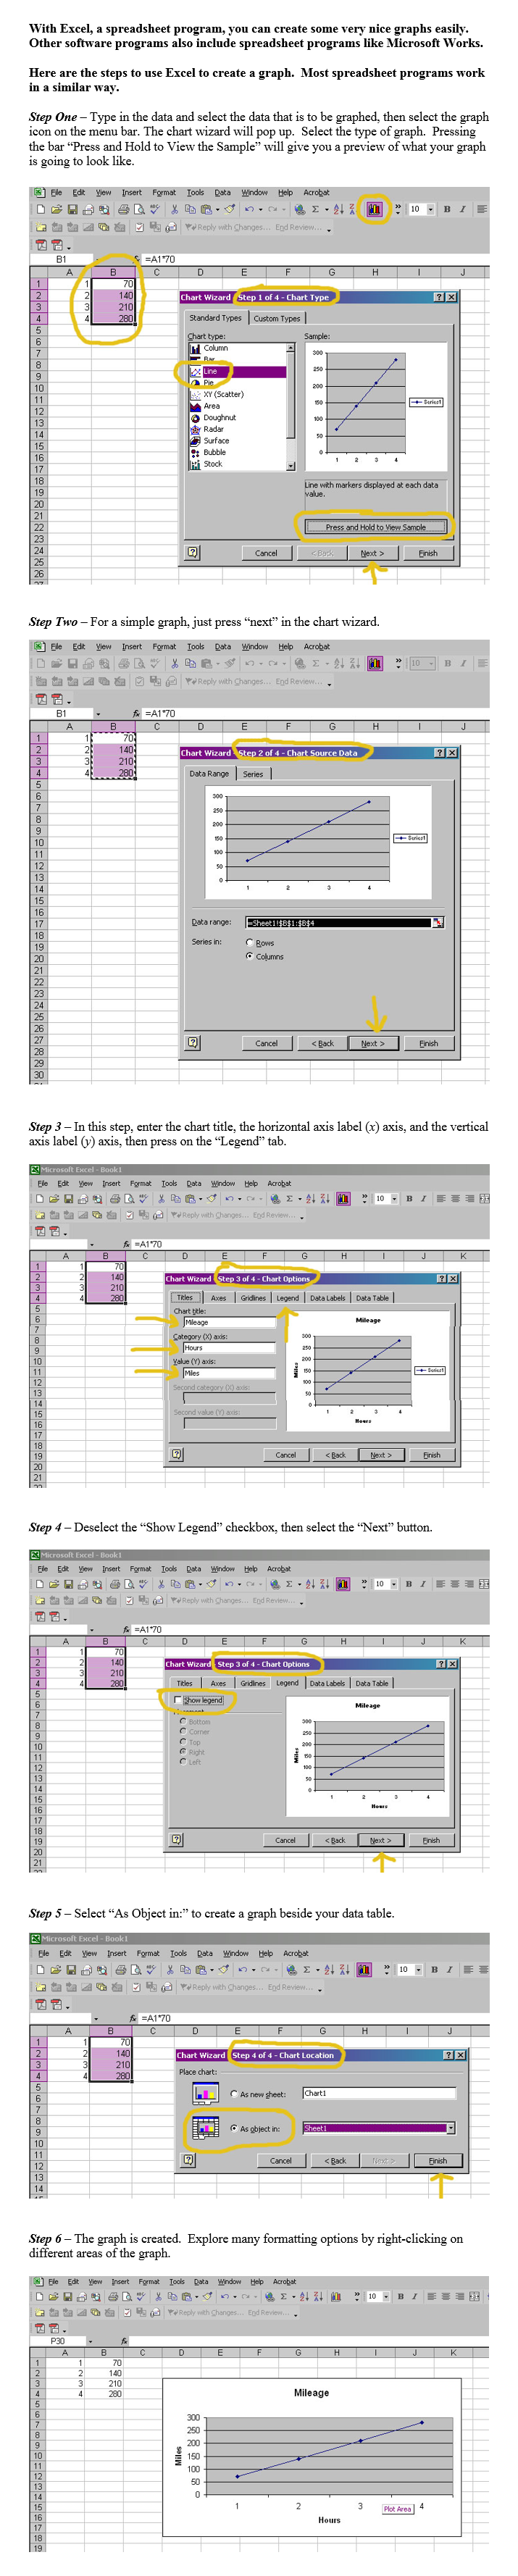
Some software programs, such as Microsoft Excel and Microsoft Works, have built‑in graphs or chart wizards that will help in constructing graphs. In this link "Using Technology to Graph Data" are steps that demonstrate how to create a graph using Excel's chart wizard. Every software program works a little differently, but generally follows the same general principle for creating graphs.
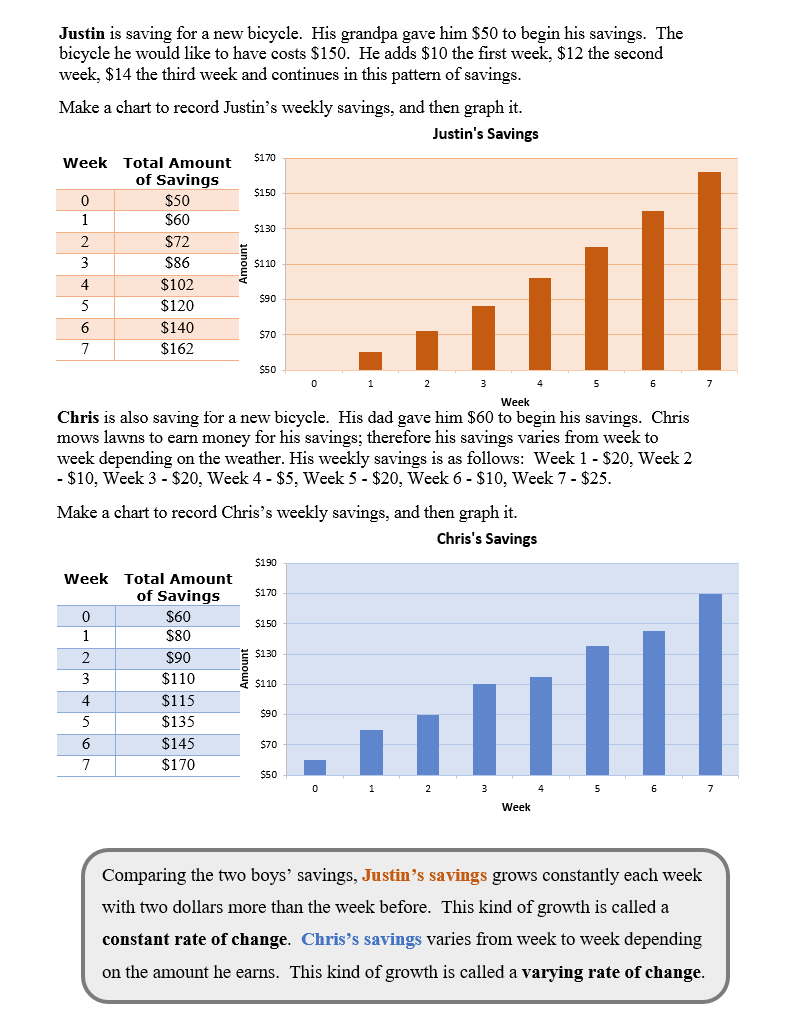
Graphs can show rates of change. Sometimes the data will change at a constant rate while times the data's rate of change will vary. Graphs give a visual way to view rates of change both constant and erratic.
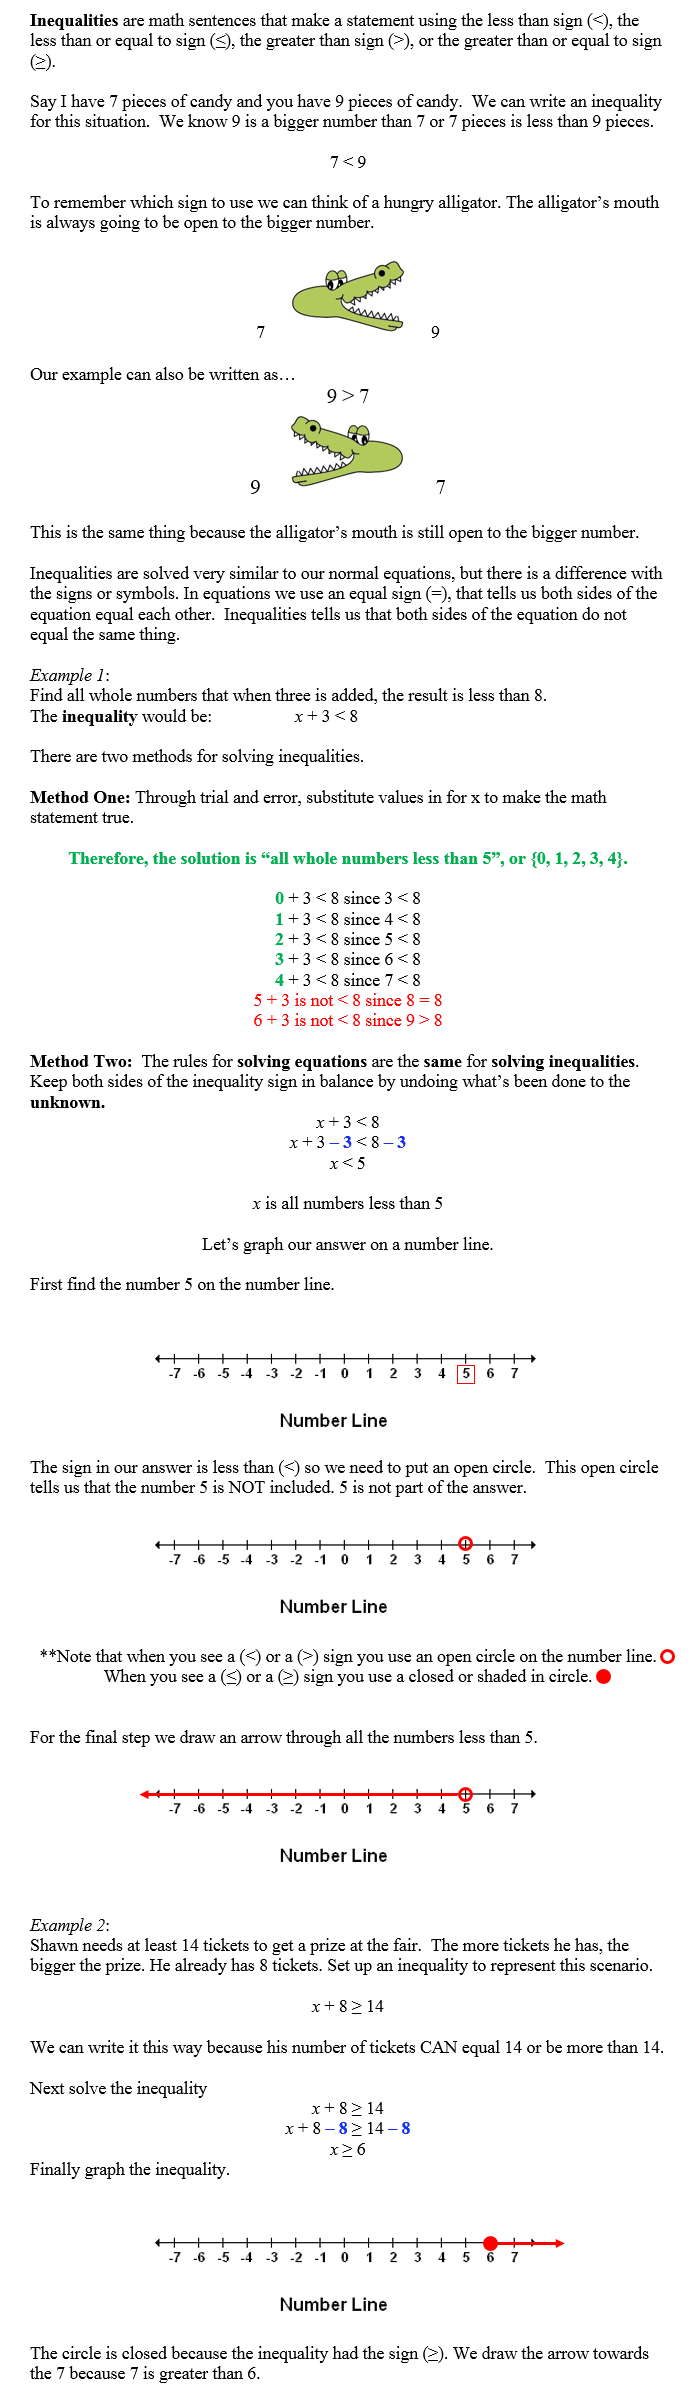
INEQUALITIES
We will now switch gears and extend our knowledge of equations to math statements called inequalities. In place of the "equals" sign, inequalities use "greater than" or "less than" signs to make a math statement. When listing answers to inequality problems, there may be several answers.| To review this section, click on the video below. |
 |
 |
For more information about inequalities, there is a video link below. |
 |
| Unit 31 Graphing Inequalities Worksheet |
| Click here to watch the video on the coordinate plane. |
| Unit 31 Define Activity |