| |
| 1) Explain how a scatter plot can be used to analyze data.
|
|
20000 character(s) left
Your answer is too long. |
|
|
Attachments |
|
| 2) When interpreting data displayed in scatter plots, what does correlation mean?
|
|
20000 character(s) left
Your answer is too long. |
|
|
Attachments |
|
| 3) What type of relationship is illustrated in the scatter plot shown below?
|
 |
|
|
| |
|
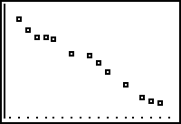
| 4) What type of relationship is illustrated in the scatter plot shown below?
|
 |
|
|
| |
|
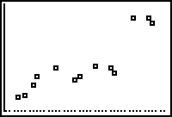
| 5) What type of relationship is illustrated in the scatter plot shown below?
|
 |
|
|
| |
|
For the next three problems, determine whether a scatter plot of the data might show a positive, negative, or no relationship; and then explain your conclusion.
|
|
|
| |
| 6) weight and month of birth
|
|
20000 character(s) left
Your answer is too long. |
|
|
Attachments |
|
| 7) study time and grades
|
|
20000 character(s) left
Your answer is too long. |
|
|
Attachments |
|
| 8) number of hours practiced running and the final place in a race
|
|
20000 character(s) left
Your answer is too long. |
|
|
Attachments |
|
| |
| 9) Explain how to find the equation of the “line of best fit.”
|
|
20000 character(s) left
Your answer is too long. |
|
|
Attachments |
|
Click here to print the graph paper.
|
|
|
| |
| 10) On graph paper, draw a scatter plot for the set of data shown below. Identify the correlation, if any, and then determine the “line of best fit.”
|
 |
20000 character(s) left
Your answer is too long. |
|
|
Attachments |
|
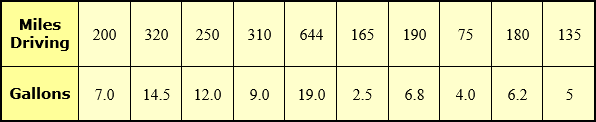
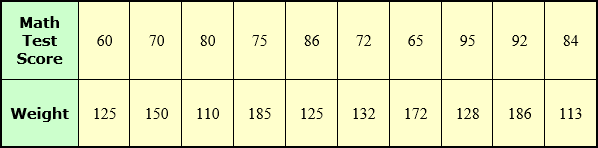
| 11) On graph paper, draw a scatter plot for the set of data shown below. Identify the correlation, if any, and then determine the “line of best fit.” Also, attach your scatterplot showing your line of best fit and the 2 points you used to find your equation for the line of best fit.
|
 |
20000 character(s) left
Your answer is too long. |
|
|
Attachments |
|
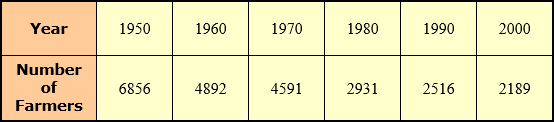
| 12) On graph paper, draw a scatter plot for the set of data shown below. Identify the correlation, if any, and then determine the “line of best fit.”
|
 |
20000 character(s) left
Your answer is too long. |
|
|
Attachments |
|
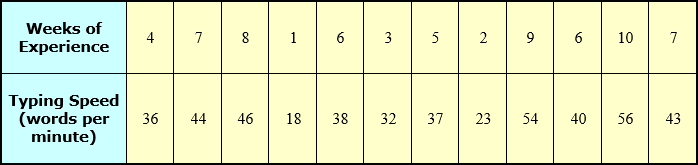
Use the data below to answer the next four problems.
|
 |
|
| |
| 13) What type of relationship, if any, does the data show between the weeks of experience and the speed?
|
|
20000 character(s) left
Your answer is too long. |
|
|
Attachments |
|
| 14) Find the equation of the line of best fit for the data.
|
|
20000 character(s) left
Your answer is too long. |
|
|
Attachments |
|
| 15) Using the equation of the line of best fit and the scatter plot, estimate the experience level of a student whose speed is 39 words per minute, and then explain how to determine the answer.
|
|
20000 character(s) left
Your answer is too long. |
|
|
Attachments |
|
| 16) In general, what can be concluded about the trend of the data?
|
|
20000 character(s) left
Your answer is too long. |
|
|
Attachments |
|
| 17) A scatter plot of the June monthly tennis shoe sales and bicycle accidents in Ohio shows a positive relationship. (a) Why might this be true? (b) Does a positive relationship necessarily mean one factor causes the other? Please explain.
|
|
20000 character(s) left
Your answer is too long. |
|
|
Attachments |
|
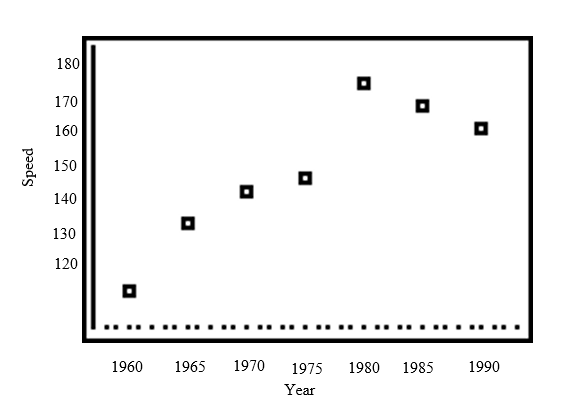
The scatter plot below shows the speed for winning the Daytona 500 from 1960 – 1990. Use this data to answer the next three problems.
|
 |
|
| |
| 18) What are the coordinates of the point that represents the fastest winning speed?
|
|
4000 character(s) left
Your answer is too long. |
|
| |
|
| 19) Use the scatter plot to predict the winning speed in 2000.
|
|
4000 character(s) left
Your answer is too long. |
|
| |
|
| 20) What conclusions can be made from the scatter plot?
|
|
4000 character(s) left
Your answer is too long. |
|
| |
|
| |
| 21) The police noticed that traffic accidents increased on Friday nights which correlates with a Friday high school football game. Does this correlation imply causation? Explain.
|
|
20000 character(s) left
Your answer is too long. |
|
|
Attachments |
|
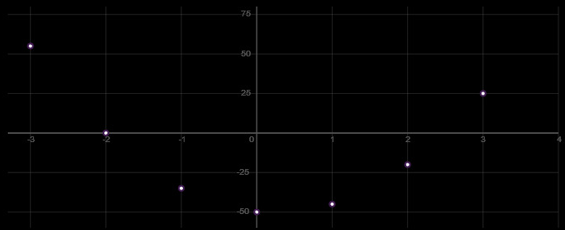
| 22) Consider the following scatterplot. Does it show a linear, quadratic, or exponential function?
|
 |
|
|
| |
|
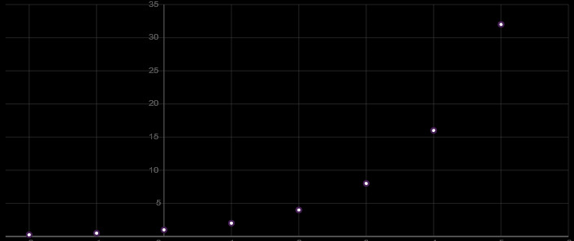
| 23) Consider the following scatterplot. Does it show a linear, quadratic, or exponential function?
|
 |
|
|
| |
|
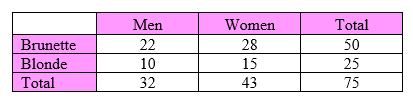
Use the 2-way frequency table below to answer the following 4 questions. It shows hair color for a group of people at a meeting.
|
 |
|
| |
| 24) Which category had the most people?
|
|
|
|
| |
|
| |
|
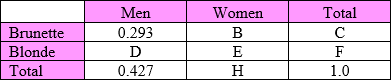
Fill in the missing values for the relative frequency chart using the table above. Use 3 decimal places.
|
 |
|
| |
| 26) Fill in values B, C, and D.
|
|
4000 character(s) left
Your answer is too long. |
|
| |
|
| 27) Fill in values for E, F, and H.
|
|
4000 character(s) left
Your answer is too long. |
|
| |
|
Review
Click here to review the unit content explanation for Expressions, Variables, and Properties.
Click here to review the unit content explanation for Linear Functions
Click here to review the unit content explanation for Linear Equations and Graphs
Click here to review the unit content explanation for More Systems of Equations
Click here to review the unit content explanation for Quadratics
Click here to review the unit content explanation for More on Quadratics
Click here to review the unit content explanation for Quadratics with Complex Roots
Click here to review the unit content explanation for Functions and Inverses of Functions
|
|
|
| |
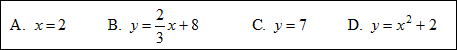
| 28) Which of the following equations represents a nonlinear function?
|
 |
|
|
| |
|
| 29) Which equation could be used to solve this problem: Four times the sum of a number and 6 is the same as 6 times the number decreased by 18?
|
|
|
|
| |
|
| |
|
| 31) Billy says that the equation y = 0.6x –2 represents a line that is parallel to the graph of 5y – 3x = 9. Is Billy correct? Explain.
|
|
20000 character(s) left
Your answer is too long. |
|
|
Attachments |
|
| 32) Emily opens a new bank account with a $300 deposit. Each week she deposits 5% of her weekly earnings. Emily earns $600 per week. Which of these equations represents the amount of money "m," in dollars, that Emily will have deposited in her checking account after "w" weeks?
|
|
|
|
| |
|
| 33) When the quadratic equation, 3x(4 – x) = 2x + 1, is written in standard form, what are the values of “a”, “b”, and “c?”
|
|
|
|
| |
|
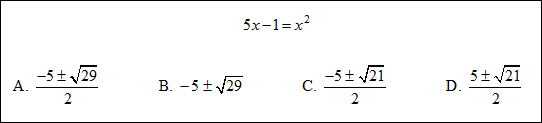
| 34) Solve the equation shown below using the quadratic formula.
|
 |
|
|
| |
|
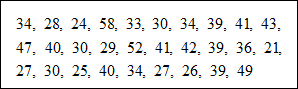
| 35) An airline recorded the weights (in pounds) of airplane luggage and the results of the data are shown below. Draw a histogram of the data. Select the range of data that would have the longest bar?
|
 |
|
|
| |
|
| 36) A purse contains 22 coins. Some of the coins are nickels and some are dimes. The total value of the coins is $1.45. How many dimes are in the purse? Write a system of equations, and then solve. State the system of equations, and then the solution.
|
|
4000 character(s) left
Your answer is too long. |
|
| |
|
| 37) If you were directed by your school to complete Offline Activities for this course, please enter the information on the Log Entry form. |
|
| No offline activities found |
0 Hour(s) & 0 Minute(s)
|
|
|
Attachments |
|