| |
| 1) If each of the letters in the word, MATHEMATICS, is written on a separate piece of paper, dropped in a hat, and mixed up completely, what is the chance of drawing an “A”?
|
|
4000 character(s) left
Your answer is too long. |
|
| |
|
| 2) If each of the letters of the word, PROBABILITY, is written on a separate piece of paper, dropped in a hat, and mixed up completely, what is the chance of drawing an “X”?
|
|
4000 character(s) left
Your answer is too long. |
|
| |
|
| 3) If each of the letters in the word, MISSISSIPPI, is written on a separate piece of paper, dropped in a hat, and mixed up completely, which letters would have a “4/11” chance of being drawn from the hat?
|
|
4000 character(s) left
Your answer is too long. |
|
| |
|
| |
| 4) Marilyn has 2 coats, 5 hats, and 3 pairs of gloves in her closet. Marilyn could wear how many different outdoor clothing outfits ? Make a tree diagram to solve.
|
|
4000 character(s) left
Your answer is too long. |
|
| |
|
| 5) Billy is taking a five-question True/False test. He did not study. He is going to guess on every question. How many different ways could Billy fill out the test? For Example: One way to guess is F, F, T, T, T while another guess would be T, T, F, F, F. List all possibilities and state how many there are. Draw a tree diagram to check you answer.
|
|
4000 character(s) left
Your answer is too long. |
|
| |
|
| 6) There are five persons in a group. Every person shakes every other person’s hand once. How many possible handshakes are there in all? Draw a picture to help you solve this problem.
|
|
4000 character(s) left
Your answer is too long. |
|
| |
|
| 7) Print out and complete the table by listing all possible outcomes when rolling two dice. Refer to the table to state the theoretical possibility of rolling any of the sums that occur. Write the probability as a fraction. The first sum of two is completed as an example. State the rest of the sums and their theoretical probability.
Printable Table
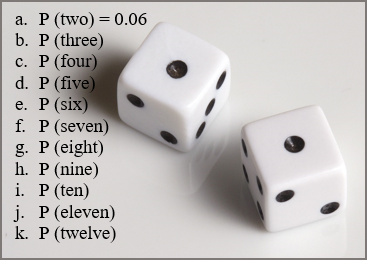
a. P (two) = 1/18
b. P (three)
c. P (four)
d. P (five)
e. P (six)
f. P (seven)
g. P (eight)
h. P (nine)
i. P (ten)
j. P (eleven)
k. P (twelve)
|
|
20000 character(s) left
Your answer is too long. |
|
|
Attachments |
|
| 8) Use the table in problem #7 to state the theoretical possibility of rolling any of the sums that occur as a decimal. For example: The probability of rolling a sum of two is 1 chance out of 36. The decimal is found by dividing 1 by 36 which would be 0.03 when rounded to the nearest hundredth. Write each of the other sums and the theoretical probability as a decimal rounded to the nearest hundredth, when necessary.
|
 |
20000 character(s) left
Your answer is too long. |
|
|
Attachments |
|
| 9) Based on the results found in problems #7 and #8, which sum is most likely to be rolled?
|
|
4000 character(s) left
Your answer is too long. |
|
| |
|
| 10) Based on the results found in problems #7 and #8, which sums are least likely to be rolled?
|
|
4000 character(s) left
Your answer is too long. |
|
| |
|
Making Predictions Based On Theoretical Probability
|
|
|
| |
| 11) Print out and complete the chart. In the chart in column two, record the theoretical probability as a decimal for each sum (found in problem #8). Find two dice. Roll the dice 50 times. Keep a tally of the results in column three of the chart. For each of the sums, write the tally as a number in column four. Based on 50 tosses, write the actual outcome for each sum as a fraction in column five, and then write the actual outcome for each sum as a decimal in the last column. In the answer box below write the sum, theoretical decimal probability, actual number of occurrences for each sum, actual outcomes as a fraction, and the actual outcomes as a decimal. For example: If the sum of three was actually rolled 6 times out of 50, in the answer box you would write: Three, 0.06, 6, 6/50, and 0.12.
Printable Chart
|
|
4000 character(s) left
Your answer is too long. |
|
| |
|
| 12) Refer to the chart in #11and compare the actual with the theoretical. Which of the sums have actual results that were close to their corresponding theoretical possibilities? Which of sums have actual results that were not close to their corresponding theoretical probabilities?
|
|
4000 character(s) left
Your answer is too long. |
|
| |
|
| 13) Print out and complete the chart. Toss the dice 100 times. In the chart in column two, record the theoretical probability as a decimal for each sum (found in problem #8). Keep a tally of the results in column three. For each of the sums, write the tally as a number in column four. Based on 100 tosses, write the actual outcome for each sum as a fraction in column five, and then write the actual outcome for each sum as a decimal in the last column. In the answer box write the sum, theoretical decimal probability, actual number of occurrences for each sum, actual outcomes as a fraction, and the actual outcomes as a decimal. Example: If the sum of three was actually rolled 15 times out of 100, you would write: Three, 0.06, 15, 15/100, and 0.15.
Printable Chart
|
|
20000 character(s) left
Your answer is too long. |
|
|
Attachments |
|
| 14) Compare the actual results for 100 tosses with the theoretical. Which of sums had actual results that were close to the theoretical possibilities? Which of sums had actual results that were not close to the theoretical probabilities?
|
|
20000 character(s) left
Your answer is too long. |
|
|
Attachments |
|
| 15) By increasing the number of trials, were the actual outcomes closer to the theoretical probability or farther away? Use data from the charts in the previous problems to support your answer.
|
|
20000 character(s) left
Your answer is too long. |
|
|
Attachments |
|
| |
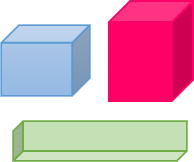
| 16) You work for a company that designs boxes for other companies. You need to design a box for 180 crayons. One possible box has 6 rows each with 30 crayons. List 3 other ways in which the crayons could be packaged. Which package would you choose? Explain why you would choose that package.
|
 |
4000 character(s) left
Your answer is too long. |
|
| |
|
| 17) Print and cut out these strips of paper. Try to form a triangle by connecting the three strips at their ends. Please explain the results.
Printable Paper Strips
|
|
4000 character(s) left
Your answer is too long. |
|
| |
|
| 18) As you have found in problem #17, there are some lengths that will not go together to make a triangle. Try some other strips of paper, measuring their lengths and then trying to make them into a triangle. Keep a record of your findings in the chart. Study the results of the data you collect in the chart and then write a rule about the length of the sides of a triangle based on what you have discovered in this problem.
Printable Chart
|
|
4000 character(s) left
Your answer is too long. |
|
| |
|
| 19) Twenty bald eagles are tagged and released into the wild. The next month, nine bald eagles are spotted, two of which are tagged. Write a proportion to find out about how many bald eagles are in the area. Solve the proportion.
|
|
|
|
| |
|
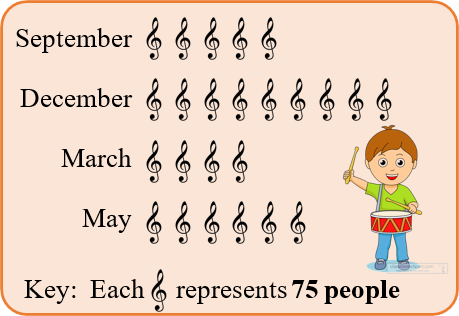
| 20) The graph shows attendance at each of the monthly school band concerts. Find the average attendance at the band concerts.
|
 |
|
|
| |
|
Solve the equations for the variable in problems #21 through #25. Check through substitution.
|
|
|
| |
| 21) 7.8 + N = –15
|
|
4000 character(s) left
Your answer is too long. |
|
| |
|
| 22) 68 = –17K
|
|
4000 character(s) left
Your answer is too long. |
|
| |
|
| 23) Solve.
|
 |
4000 character(s) left
Your answer is too long. |
|
| |
|
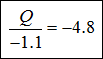
| 24) Solve.
|
 |
4000 character(s) left
Your answer is too long. |
|
| |
|
| 25) 64 = –3x – 8
|
|
4000 character(s) left
Your answer is too long. |
|
| |
|
| 26) Solve the inequality. Print out the number line and graph the solution. Describe the graph by stating the number for the starting point, open or closed point, and the direction in which the graph is pointing. Determine the direction of the graph by testing a point.
4 p ≥ –22
Printable Number Line
|
|
4000 character(s) left
Your answer is too long. |
|
| |
|
| 27) If you were directed by your school to complete Offline Activities for this course, please enter the information on the Log Entry form. |
|
| No offline activities found |
| 0 Hour(s) & 0 Minute(s) |
|
|
Attachments |
|