| 1) Print out the chart below. As you sit at your computer, place your index and middle finger on your neck right below your chin until you feel your heartbeat. Count the number of heartbeats in 10 seconds. Perform the activities in the chart and then fill in results. State each activity and the data collected (number of heartbeats in 10 seconds) for each activity.
Printable Table
|
|
4000 character(s) left
Your answer is too long. |
|
| |
|
| 2) Make a line graph on paper plotting the activities in problem #1 against number of heartbeats. Based on the graphed data, describe and write what effect the increased activity made on the number of heartbeats.
|
|
4000 character(s) left
Your answer is too long. |
|
| |
|
| 3) Research the Internet and find out what good effects increasing activity can have on the physical body. Write at least two positive effects.
|
|
4000 character(s) left
Your answer is too long. |
|
| |
|
Graphs That Show a Relationship Between Two Variables
|
|
|
| |
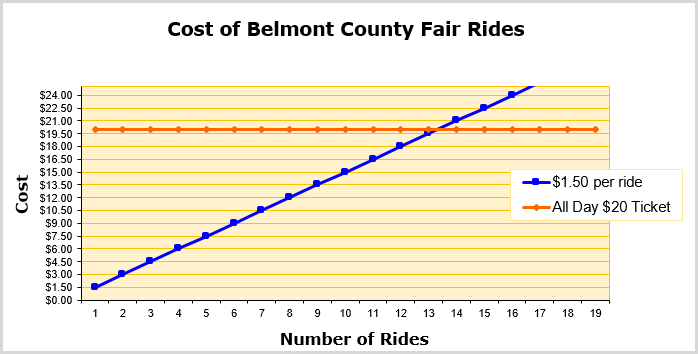
| 4) At the Belmont County Fair, James found there were two ways to pay for carnival rides. One way was to pay for an all-day pass for $20.00. The other way was to pay $1.50 for each ride. Study the graph below and state how many rides James would need to take before he would save money by buying the all-day pass.
|
 |
4000 character(s) left
Your answer is too long. |
|
| |
|
| 5) At the Jefferson County Fair, James found there were two ways to pay for carnival rides. One way was to pay for an all-day pass for $25.00. The other way was to pay $2 for each ride. On paper make a double-line graph with one line that shows the constant price of $25 and a second line that shows the number of rides priced at $2 each. How many rides would James take before he would save money by buying the all-day pass?
|
|
4000 character(s) left
Your answer is too long. |
|
| |
|
| |
| 6) Some researchers say that exercise will make your brain work better! Let’s test this theory. Make a memory test by finding 25 different items in the house and then covering them up with a towel. Ask some of your friends or family members to take the test. Remove the towel and give them one minute to stare at the items. After one minute has passed, cover the items and have them write down as many objects as they can remember. Then split your friends/family members into two groups. For ten minutes have one group watch TV while the other group performs exercises (run in place, do jumping jacks, etc.). While the two groups are watching TV and exercising, find 25 new items for the memory test. At the end of the ten minutes, have the two groups take a second memory test. Print out the chart and record the results of both tests. State each person’s first name or initials, results of first test, and results of second test.
Printable Chart
|
|
4000 character(s) left
Your answer is too long. |
|
| |
|
Comparing Change with a Double Bar Chart
|
|
|
| |
| 7) On paper make two double bar graphs for the data collected in problem #6, one for the "Easy Going Team" and one for the "Energetic Team". For each team member, draw two bars to compare the results of the first test with the results of the second test. Describe the two graphs in detail and summarize the results of the data that supports or discredits the theory proposed.
|
|
20000 character(s) left
Your answer is too long. |
|
|
Attachments |
|
| |
| 8) Print out the chart below and survey family members and friends to find which animal is their favorite? Give them three choices and use “other” as the fourth choice. From the data collected, draw a circle graph on paper to display the results. State the category, number of responses per category, and the percent of the pie given for each category. Describe the graph, stating which section of the pie graph is largest and which one is smallest.
Printable Table
|
|
20000 character(s) left
Your answer is too long. |
|
|
Attachments |
|
Statistics and Histograms
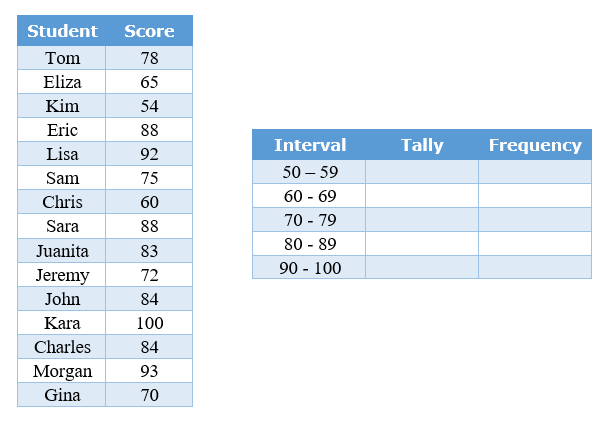
Below are the test results of Ms. Garcia’s class and a chart to organize the data. Record a tally for each piece of data in the chart with intervals and then write the frequency by adding up the tally for each interval. Make a histogram on paper for the results and then answer questions #9 through #12.
|
 |
|
| |
| 9) Which interval has the highest frequency?
|
|
4000 character(s) left
Your answer is too long. |
|
| |
|
| 10) Which interval has the lowest frequency?
|
|
4000 character(s) left
Your answer is too long. |
|
| |
|
| 11) Is the data symmetrical or skewed? Please explain your choice.
|
|
4000 character(s) left
Your answer is too long. |
|
| |
|
| 12) What is the mean of the data? Round to nearest hundredth.
|
|
4000 character(s) left
Your answer is too long. |
|
| |
|
Stem and Leaf Plot
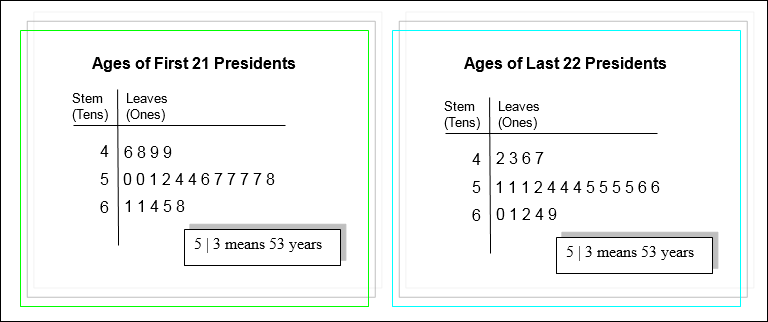
Below are two stem-and-leaf plots for the ages of the first 21 presidents and the ages of the last 22 presidents. Print out the table, calculate the information requested, and then answer the next seven questions.
Printable Table
|
 |
|
| |
| 13) What is the median age for the first 21 presidents? What is the median age for the last 22 presidents?
|
|
4000 character(s) left
Your answer is too long. |
|
| |
|
| 14) What is the mode for the first 21 presidents’ ages? What is the mode for the last 22 presidents’ ages?
|
|
4000 character(s) left
Your answer is too long. |
|
| |
|
| 15) What is the mean for the first 21 presidents’ ages? What is the mean for the last 22 presidents’ ages?
|
|
4000 character(s) left
Your answer is too long. |
|
| |
|
| 16) What is the range of ages for the first 21 presidents? What is the range of ages for the last 22 presidents?
|
|
4000 character(s) left
Your answer is too long. |
|
| |
|
| 17) What is the oldest age for the first 21 presidents? What is the oldest age for the last 22 presidents?
|
|
4000 character(s) left
Your answer is too long. |
|
| |
|
| 18) What is the youngest age for the first 21 presidents? What is the youngest age for the last 22 presidents?
|
|
4000 character(s) left
Your answer is too long. |
|
| |
|
| 19) Compare the results of the first 21 presidents with the last 22 presidents in problems #13 - #18. Identify some trends that you observe with the data and explain your observations.
|
|
4000 character(s) left
Your answer is too long. |
|
| |
|
| 20) For the top 20 leading rushers in professional football, below is the number of years played by each of them. On paper make a stem-and-leaf-plot to organize the data and then state the median, mode, mean, and range.
13 11 12 9 13 14 11 16 8 12 10 14 10 13 9 7 10 10 8 14
|
|
20000 character(s) left
Your answer is too long. |
|
|
Attachments |
|
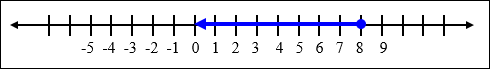
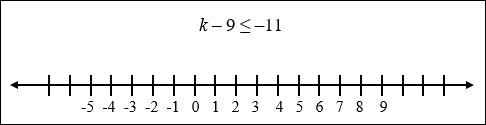
| 21) Write an inequality for the graph.
|
 |
4000 character(s) left
Your answer is too long. |
|
| |
|
| 22) Margie is building a triangular shaped display of facial tissues in the supermarket. The display is ten rows high. There are 10 boxes of tissues in the bottom row. If there is one less box in each of the rows above, how many boxes will Margie use to build the display? Draw a picture for the solution on paper. Describe your picture and explain how you solved this problem
|
|
20000 character(s) left
Your answer is too long. |
|
|
Attachments |
|
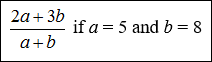
| 23) Evaluate.
|
 |
|
|
| |
|
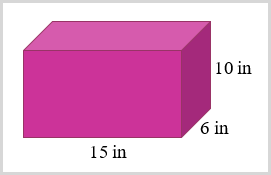
| 24) Find the surface area of the rectangular prism.
|
 |
4000 character(s) left
Your answer is too long. |
|
| |
|
| 25) Write a simplified algebraic expression for the phrase, “the product of n and 5 decreased by 8.
|
|
4000 character(s) left
Your answer is too long. |
|
| |
|
For problems #26 and #27, solve the equation for the variable . Check answers through substitution.
|
|
|
| |
| 26) 7.2m = –10.8
|
|
4000 character(s) left
Your answer is too long. |
|
| |
|
| 27) 9b – 8 = 217
|
|
4000 character(s) left
Your answer is too long. |
|
| |
|
| 28) Print out the number line, solve the inequality, and graph the solution. Determine the direction of the line by testing a point on the graph. Describe the graph of the inequality by stating the location of the beginning point of the graphed arrow, stating whether the beginning point is open or closed, and stating the direction the graphed arrow is pointing. Also write a general statement describing all solutions.
Printable Number Line
|
 |
20000 character(s) left
Your answer is too long. |
|
|
Attachments |
|
| 29) Print out the table. Choose five values for x and then find the corresponding y value for the linear equation, y = 2x – 1. Write the ordered pairs.
Printable Table
|
|
4000 character(s) left
Your answer is too long. |
|
| |
|
| 30) Print out the coordinate plane. Graph the five ordered pairs found in problem #29 and draw a straight line through the five points.
a) State the ordered pair for the point where the graphed line crosses the x-axis.
b) State the ordered pair for the point where the graphed line crosses the y-axis.
c) State an ordered pair for another point on the line that is not listed in the table.
Printable Coordinate Plane
|
|
4000 character(s) left
Your answer is too long. |
|
| |
|
| 31) If you were directed by your school to complete Offline Activities for this course, please enter the information on the Log Entry form. |
|
| No offline activities found |
| 0 Hour(s) & 0 Minute(s) |
|
|
Attachments |
|