| Some activities may require making graphs on paper. Click here to view and print graph paper, as needed. |
|
|
| |
| |
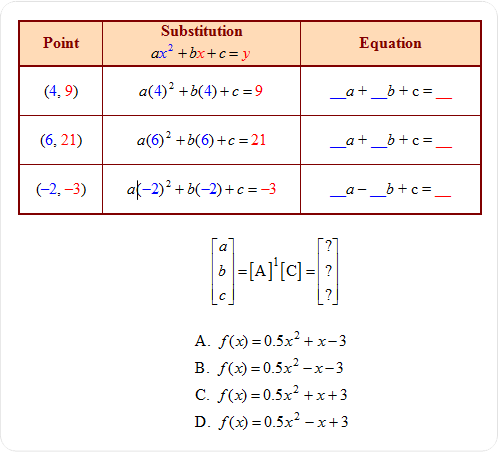
| In the following problems, solve by determining a system of equations using the three given points. Then, set up matrix equations and solve by multiplying the INVERSE of the coefficient matrix times the constant matrix to find a quadratic function that fits each set of data. |
|
|
| |
| 1) What is the quadratic function that fits the following data: (4, 9), (6, 21), (–2, –3)? |
 |
|
|
| |
|
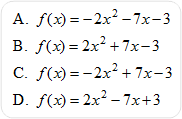
| 2) What is the quadratic function that fits the following data: (3, 0), (–1, –12), (2, 3)? |
 |
|
|
| |
|
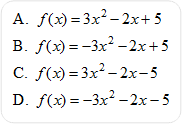
| 3) What is the quadratic function that fits the following data: (1, 6), (2, 13), (–2, 21)? |
 |
|
|
| |
|
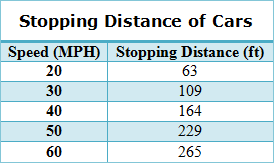
Quadratic Regression
The table below shows the stopping distance, in feet, of a car traveling at various speeds in miles per hour. Refer to this table to answer the following questions. |
 |
|
| |
| |
|
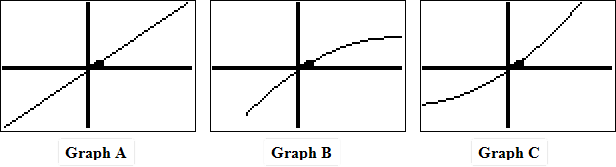
| 5) Which graph best matches the regression equation for the given data points about the stopping distance required of a traveling car? (Hint: Zoom out to get a broader view of the graph of the equation.) |
 |
|
|
| |
|
| |
In the following problems, solve each inequality. Select the correct answer.
Hint: To solve the quadratic inequalities:
(1) factor each expression first
(2) apply the Zero Product Property to determine the critical points that can be used to divide the x-axis into sections for testing
(3) test a point in each section to determine what area to shade |
|
|
| |
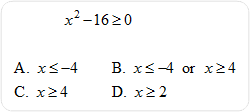
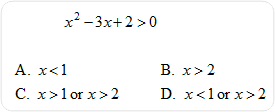
| 6) Solve for x. |
 |
|
|
| |
|
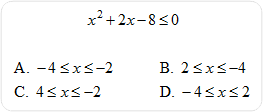
| 7) Solve for x. |
 |
|
|
| |
|
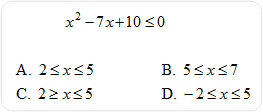
| 8) Solve for x. |
 |
|
|
| |
|
| 9) Solve for x. |
 |
|
|
| |
|
| Graphing Quadratic Inequalities |
|
|
| |
In the following problems, graph each inequality on paper. If the given graph is correct, state True; if it is not correct, state False and explain why the graph is incorrect.
Hint: To graph quadratic inequalities, it is helpful to put the function into vertex form, and then graph. After determining the vertex point (h, k), then choose additional points around the vertex to see the parabolic shape develop. |
|
|
| |
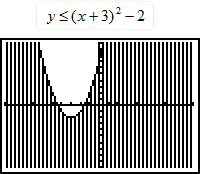
| 10) Is the given graph correct? If not, why not? |
 |
4000 character(s) left
Your answer is too long. |
|
|
Attachments |
|
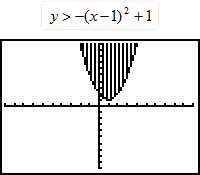
| 11) Is the given graph correct? If not, why not? |
 |
4000 character(s) left
Your answer is too long. |
|
|
Attachments |
|
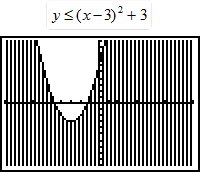
| 12) Is the given graph correct? If not, why not? |
 |
4000 character(s) left
Your answer is too long. |
|
|
Attachments |
|
| |
| |
|
| |
|
15) Solve the compound inequality: 5x – 2 < 3 or 2x – 6 < 4
Click here to review the unit content explanation for Solving Equations and Applications. |
|
4000 character(s) left
Your answer is too long. |
|
| |
|
| |
|
| |
|
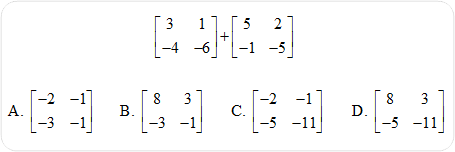
18) Find the sum of the two matrices.
Click here to review the unit content explanation for Matrices. |
 |
|
|
| |
|
| |
|
| |
|
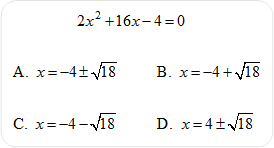
21) Solve by completing the square.
Hint: First, factor out a common number of the coefficients of the variable terms.
Click here to review the unit content explanation for Solving Quadratic Equations. |
 |
|
|
| |
|
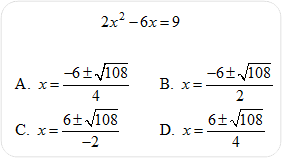
| 22) Use the quadratic formula to solve for x.
Hint: First put the equation in standard form.
Click here to review the unit content explanation for Solving Quadratic Equations.
|
 |
|
|
| |
|
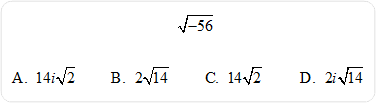
| 23) Simplify.
Hint: Express –56 as (–1)(56) and then factor.
Click here to review the unit content explanation for Complex Numbers.
|
 |
|
|
| |
|
| 24) If you were directed by your school to complete Offline Activities for this course, please enter the information on the Log Entry form. |
|
| No offline activities found |
0 Hour(s) & 0 Minute(s)
|
|
|
Attachments |
|