DISPLAYING DATA IN APPROPRIATE GRAPHS
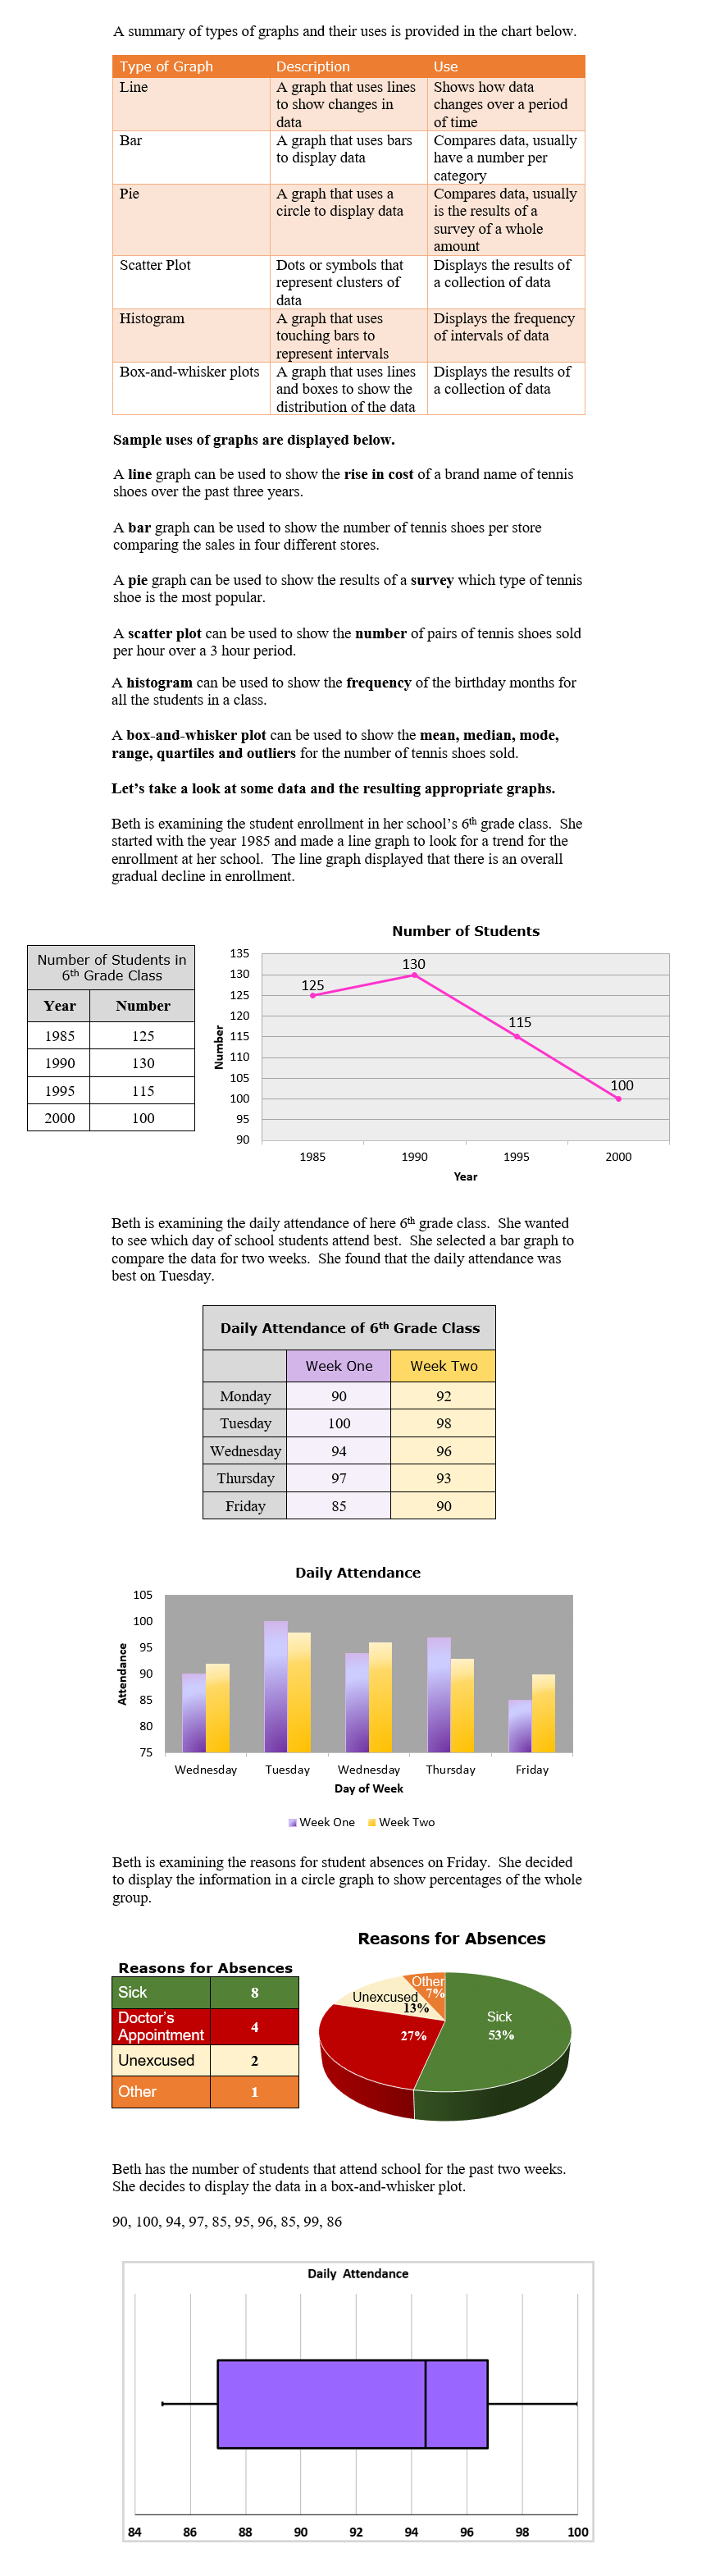
Graphs are visual ways to summarize data. Some data is better displayed in a circle graph while other data is most effectively displayed in a line graph. We’ll take a look at a summary of the types of graphs and the displaying data in appropriate graphs.
|
 |
| Click here to watch and practice scatter plots. |
| Click here to watch and practice histograms. |
| Click here to watch and practice box and whisker plots. |
| Unit 34 Reading Pie Graphs Worksheet |
| Unit 34 Single Line Graphing Worksheet |
| Unit 34 Reading Bar Graphs Worksheet |
| Unit 34 Box and Whisker Plots Worksheet |