STATISTICS AND HISTOGRAMS
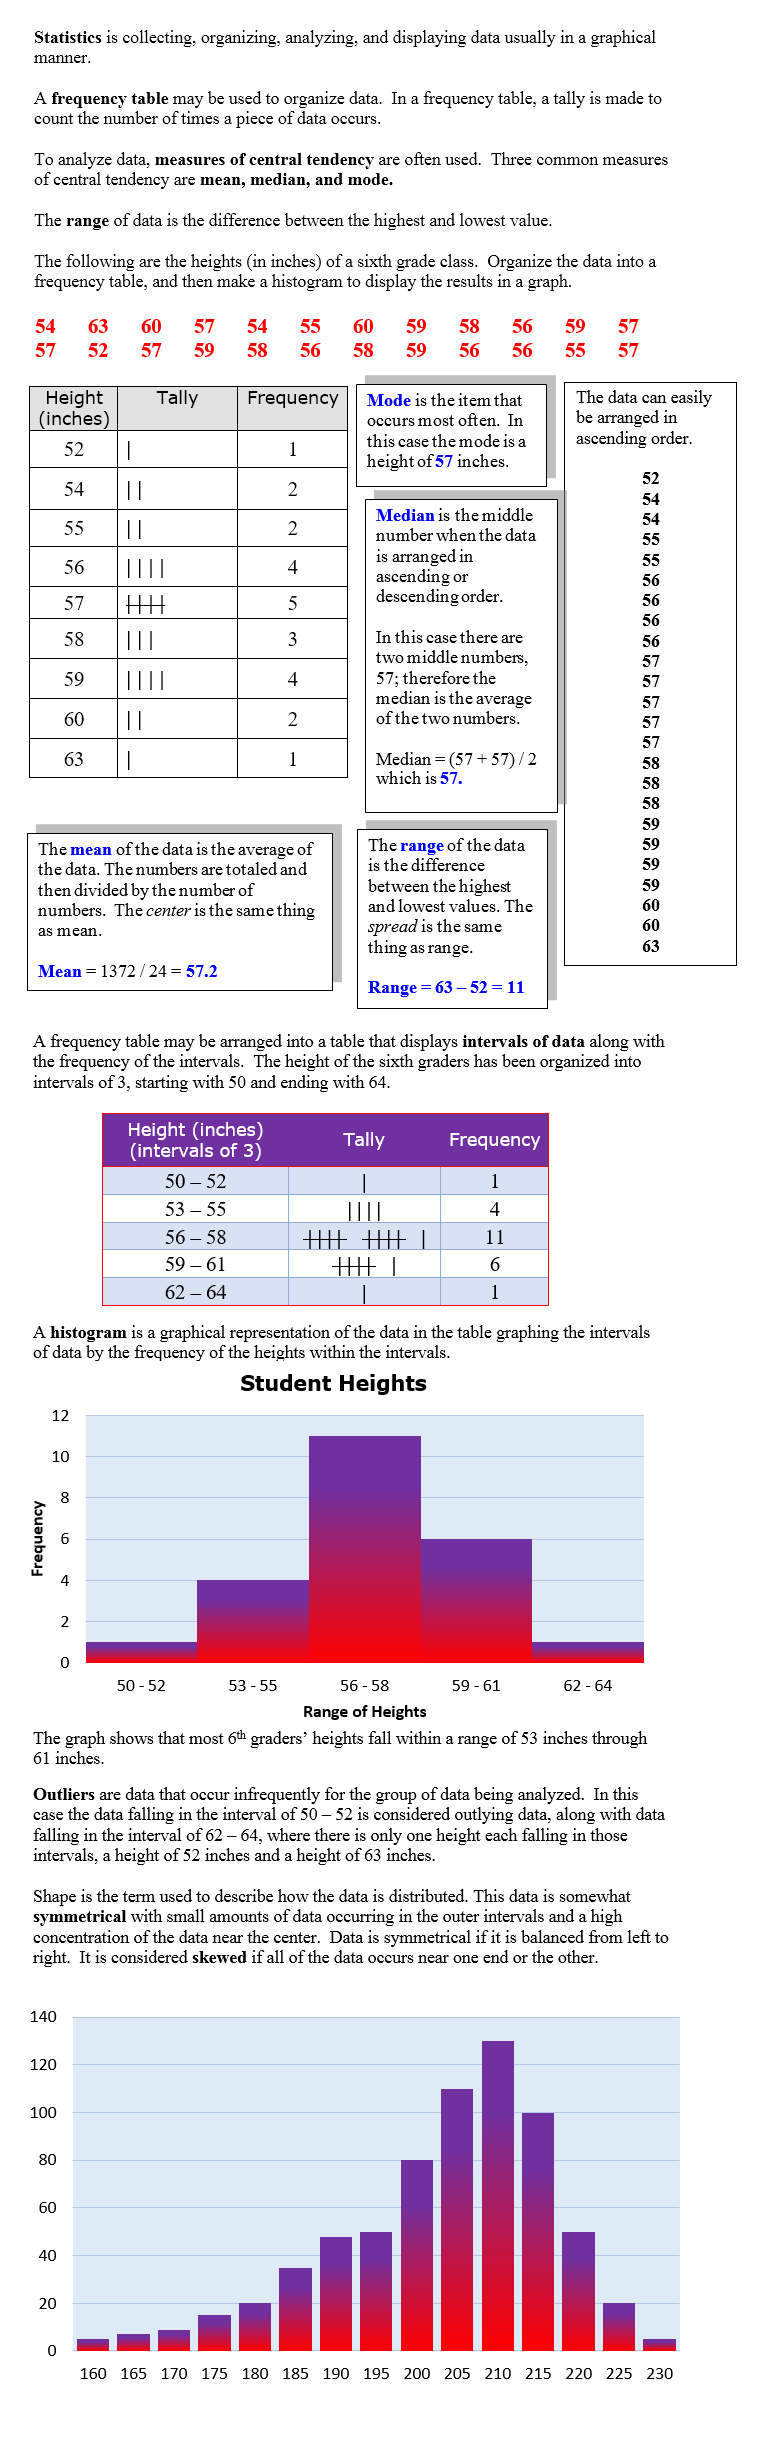
Data may be analyzed through organizing it into frequency tables, examining the central measures of tendency, and then graphing the results as a histogram. We will look at the statistics of data and graphing a histogram.
|
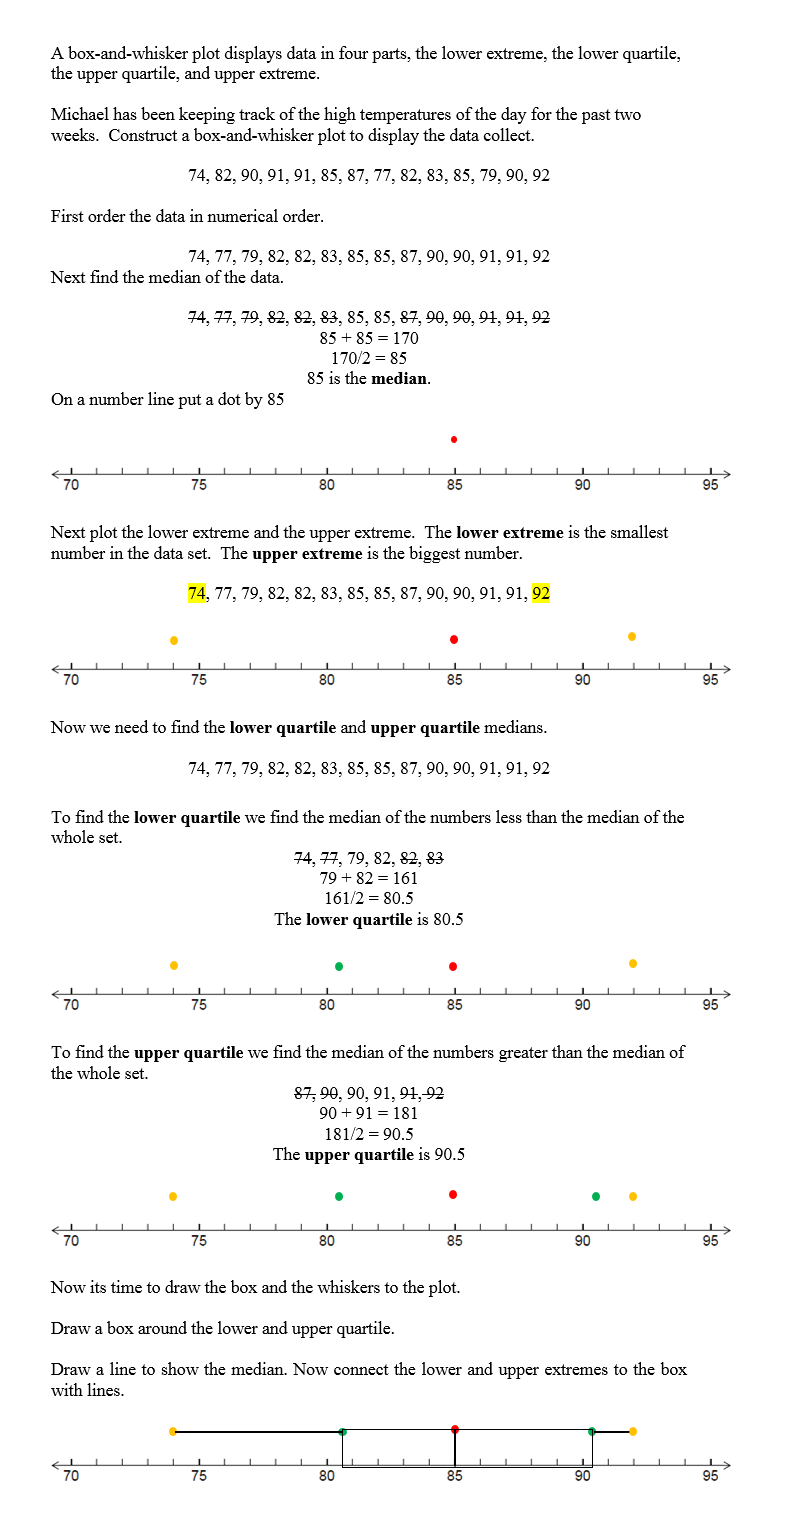
Box-and-Whisker Plots
 |
 |
| Click here to watch and practice histograms. |
| Click here to watch and practice box and whisker plots. |
| Unit 33 Box and Whiskers Plots Worksheet |
| Unit 33 Box and Whiskers Plots Word Problems Worksheet |