PDF File
CONSTRUCTING LINE GRAPHS, CIRCLE GRAPHS, AND HISTOGRAMS
Graphs are used to organize data into a graphical visual display of data that can be interpreted more easily. A line graph shows change of data over time displaying increases and decreases. A circle graph is a graphical representation of a whole group of data divided up into parts. A histogram is a special bar graph that represents the frequency of data that has been organized into intervals.
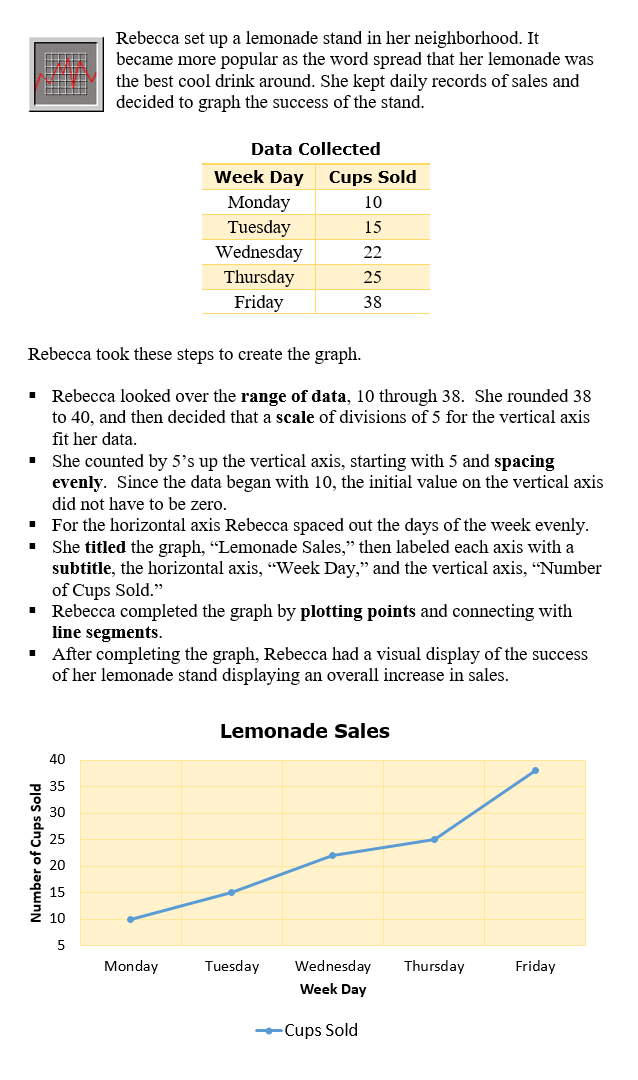
Constructing a Line Graph
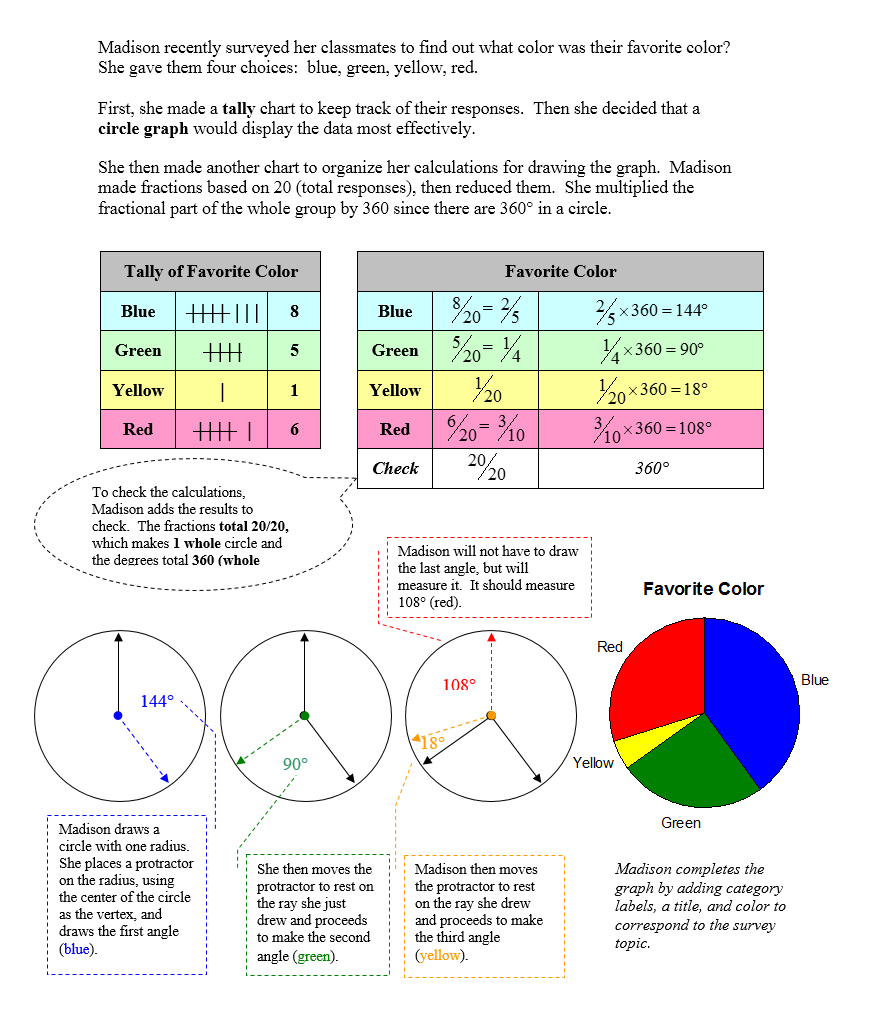
Constructing a Circle Graph
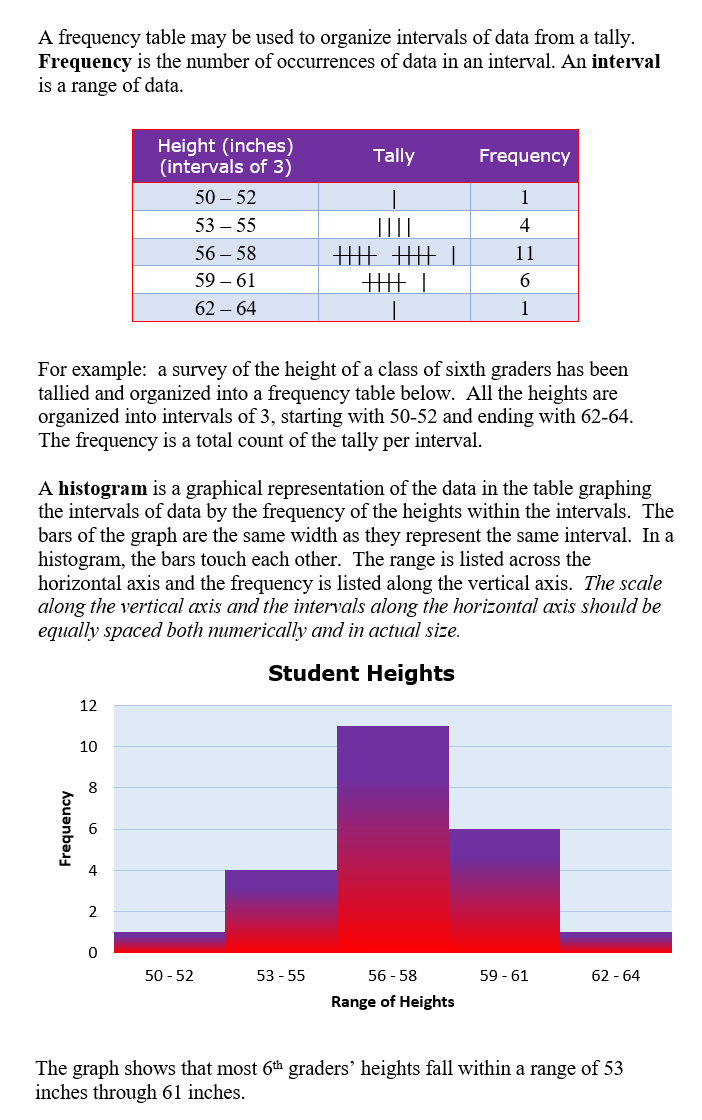
Constructing a Frequency Table and Histogram