Types of Graphs
Sample uses of graphs
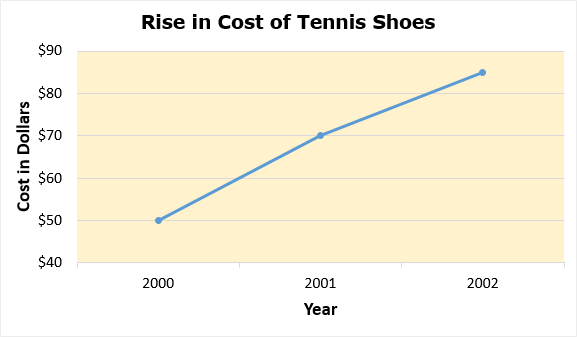
A line graph can be used to show the rise in cost of a brand name of tennis shoes over the past three years.
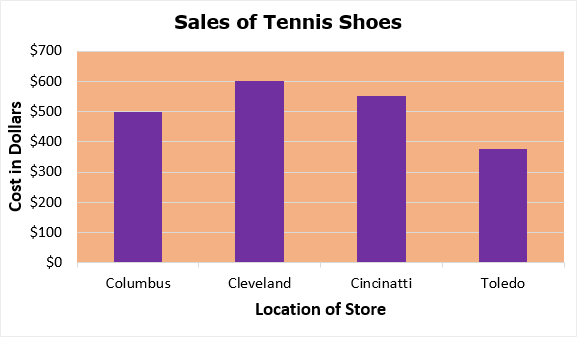
A bar graph can be used to show the number of tennis shoes per store comparing the sales in four different stores.
A pie graph can be used to show the results of a survey which type of tennis shoe is the most popular.
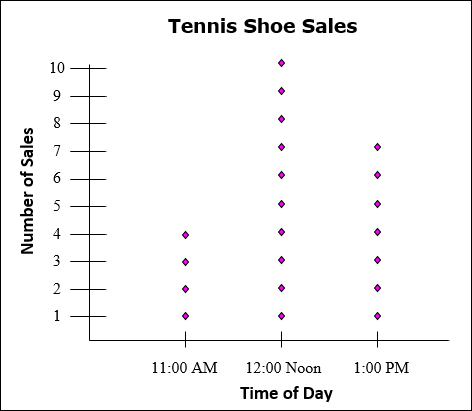
A line plot can be used to show the number of pairs of tennis shoes sold per hour over a 3 hour period.
Line Graph
 |
Bar Graph
 |
Pie Chart
 |
Line Plot
 |