PDF File | Theorems and Postulates

DATA ANALYSIS

In the first part of this unit you will process data using measures of central tendency and measures of variation.  You will then examine and analyze displays of data in various types of graphs.  You will also compare biased and unbiased samples of data.


 Box-and-Whisker Plots--Popular Dog Size (02:58)
 
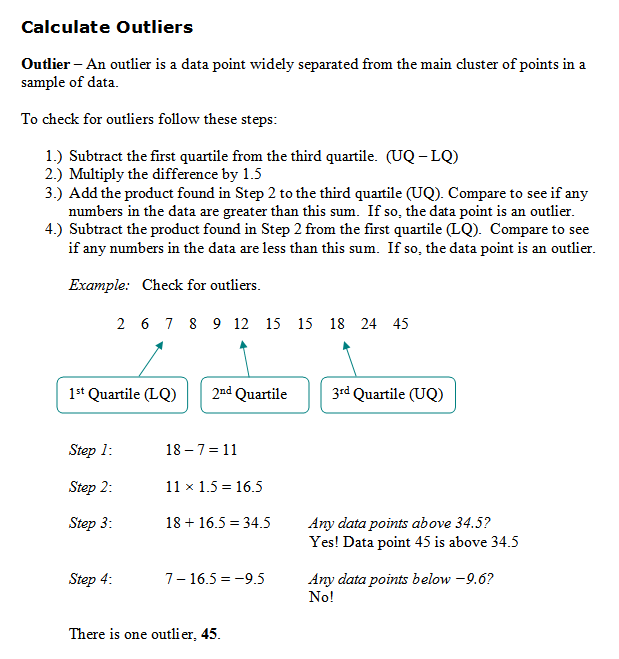
 Outliers (09:56)
 
  Scatterplots--Dog Breed Weight and Height (02:44)
 Line Graphs and Scatterplots--Caribou and Gators (03:16)
 

 Frequency Distribution and Line Graphs--High Temperatures (02:03) 
 
 Random Samples--Beetles (02:17) 
 Bias in Sampling--Jellyfish (01:46)
 Sampling Error--Tarantulas (04:04)