PDF File
MATCH DATA WITH GRAPHICAL REPRESENTATION
Unit Overview
In this unit, you will be examining various types of graphs. You will look at data graphed in a line graph, bar graph, and a circle graph. You will also consider the given data and determine the best graphical representation for the set of data.
Line Graph
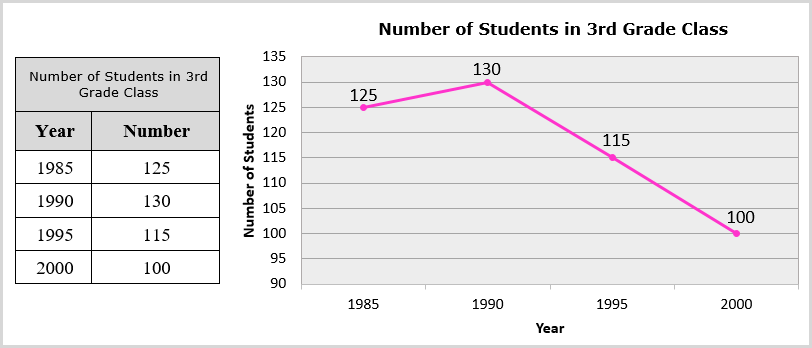
Beth is examining the student enrollment in her school's 3rd grade class. She started with the year 1985 and made a line graph to look for a trend for the enrollment at her school. The line graph displayed that there is an overall gradual decline in enrollment.
Bar Graph
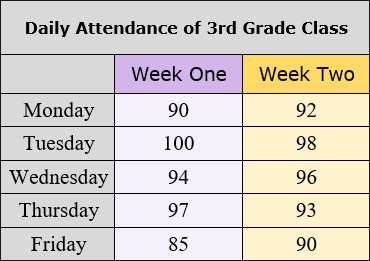
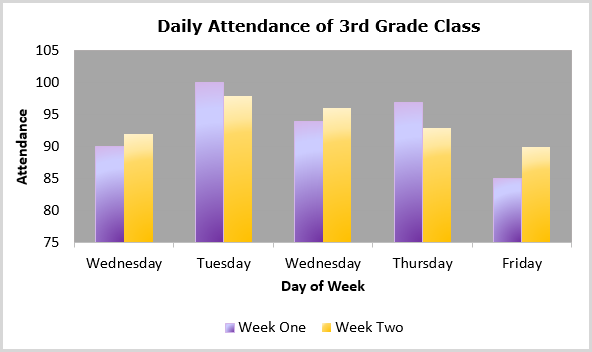
Beth is examining the daily attendance of here 3rd grade class. She wanted to see which day of school students attend best. She selected a bar graph to compare the data for two weeks. She found that the daily attendance was best on Tuesday.
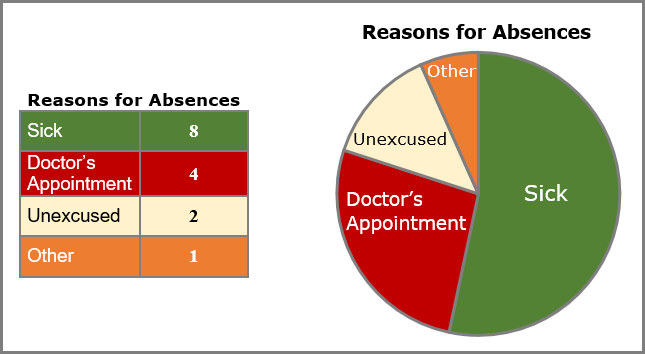
Circle Graph
Beth is examining the reasons for student absences on Friday. She decided to display the information in a circle graph to show percentages of the whole group.
Student Practice