In this unit, you will organize data by placing it into a table. After the information is in the table, you will be asked to answer questions about the data on the table.
Organize Data in a Table
The material that you will see is unorganized. How could you organize this to make it easy to deal with? The best way to organize this would be to put it into a table. A table makes everything in an order so that all information is easy to see and you can analyze the data.
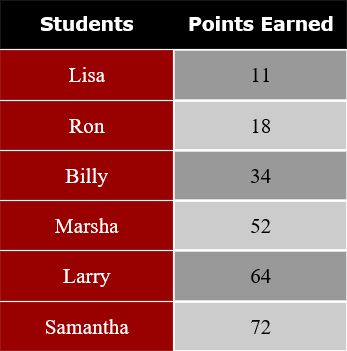
Marsha 52 points
Billy 34 points
Ron 18 points
Lisa 11 points
Samantha 72 points
Larry 64 points
Six students played a multiplication game. They received 1 point for each answer correctly answered.
The same data is placed into a table to organize the students and the points. Now, the information is ready to be used. Who had the most points? It is easy to see that Samantha had the most points. It is now organized and questions are easily answered.
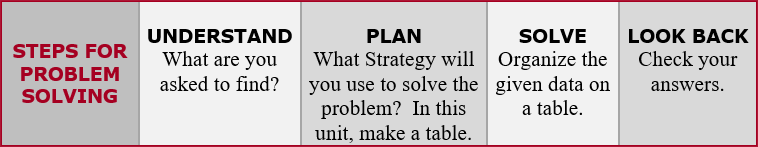
Using a table can help you solve problems and organize information. Here are the 4 steps to problem solving.
Pictograph
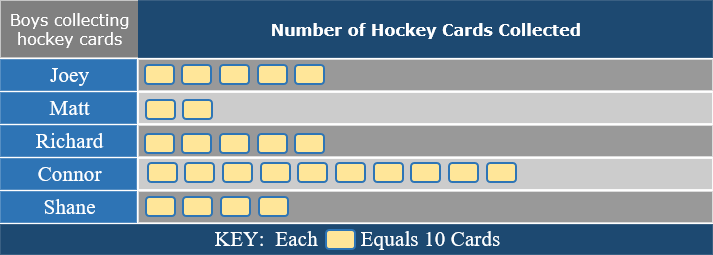
We often use a graph to show information and to compare information. The graph that we are using in this unit is a PICTOGRAPH. A Pictograph uses pictures or symbols on the graph and the key shows how many each picture or symbol stands for.
Below is an example of a pictograph.
Joey has collected 50 hockey cards because each card equals 10 cards.
Can you tell how many cards Matt has collected? Matt has collected 20 cards.
Who has collected the most hockey cards? Connor has collected the most.
How many cards has Connor collected? Connor has collected 100 cards.