| |
|
| |
|
| |
|
| |
|
| |
|
| |
|
| 7) Which metric prefix means 1/1000 of the base unit? |
|
|
|
| |
|
| 8) Which measure could be the distance between Columbus, OH and Wheeling, WV? |
|
|
|
| |
|
| |
|
| |
|
| |
|
| |
|
| 13) Which measure could be the weight of a fifth grade student? |
|
|
|
| |
|
| |
|
| 15) Which measure could be the amount of liquid in a medicine dropper? |
|
|
|
| |
|
| |
|
| |
|
| |
|
| 19) What type of angle is shown above? |
|
|
|
| |
|
| 20) Which lines are shown?
|
 |
|
|
| |
|
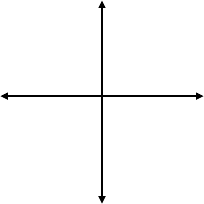
| 21) Which lines are shown?
|
 |
|
|
| |
|
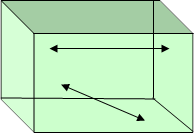
| 22) Which lines are shown?
|
 |
|
|
| |
|
| |
|
| |
|
| |
|
| |
|
| 27) Identify the shape.
|
 |
|
|
| |
|
| |
|
| |
|
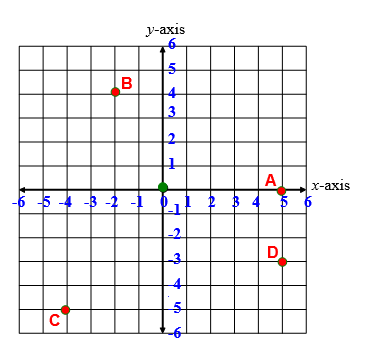
For problems #30 through #33, write the ordered pair for the graphed points?
|
 |
|
| |
| |
|
| |
|
| |
|
| |
|
Use this set of data that represents the temperatures over a seven day period to solve problems #34 through #37.
78 78 80 85 90 88 76
|
|
|
| |
| |
|
| |
|
| |
|
| |
|
| |
|
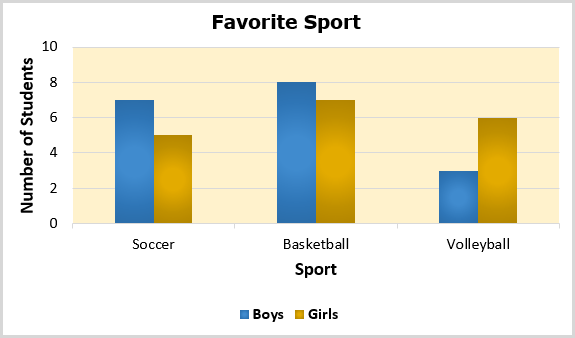
Use the chart to answer questions #39 through #42 about Robby’s survey of his classmates about their favorite sport.
|
 |
|
| |
| |
|
| |
|
| |
|
| |
|
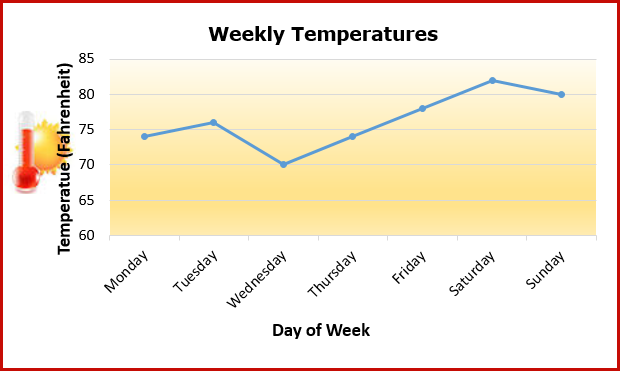
Use the chart to answer questions #43 and #44 about Sabrina’s graph of the week’s temperatures.
|
 |
|
| |
| 43) Between which two days did the temperature change the most? |
|
4000 character(s) left
Your answer is too long. |
|
| |
|
| 44) What is the trend of the temperatures’ change? |
|
|
|
| |
|
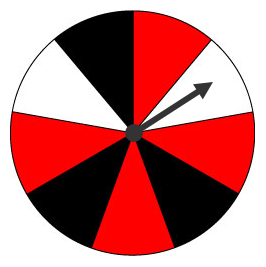
Use the spinner to answer the questions #45 through #47 about probability.
|
 |
|
| |
| |
|
| |
|
| |
|
| |
|
| |
|
| 50) Write a percent, fraction, and decimal represented by the shaded squares in this hundred square. Select the best choice.
|
 |
|
|
| |
|
| 51) If you were directed by your school to complete Offline Activities for this course, please enter the information on the Log Entry form. |
|
| No offline activities found |
| 0 Hour(s) & 0 Minute(s) |
|
|
Attachments |
|