Box-and-Whiskers Plots
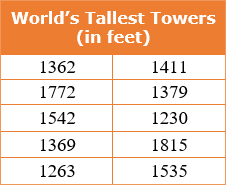
Use the data in the chart to answer the questions #1 through #7.
|
 |
|
| |
| 1) Define median. What is the median for the data?
Click here to view the chart.
|
|
4000 character(s) left
Your answer is too long. |
|
| |
|
| 2) Define upper quartile. What is the upper quartile for the data?
Click here to view the chart.
|
|
4000 character(s) left
Your answer is too long. |
|
| |
|
| 3) Define lower quartile. What is the lower quartile for the data?
Click here to view the chart.
|
|
4000 character(s) left
Your answer is too long. |
|
| |
|
| 4) Define the interquartile range. What is the interquartile range for the data?
Click here to view the chart.
|
|
4000 character(s) left
Your answer is too long. |
|
| |
|
| 5) Define the upper extreme. What is the upper extreme for the data?
Click here to view the chart.
|
|
4000 character(s) left
Your answer is too long. |
|
| |
|
| 6) Define the lower extreme. What is the lower extreme for the data?
Click here to view the chart.
|
|
4000 character(s) left
Your answer is too long. |
|
| |
|
| 7) Define outlier. What is the value of the outlier?
Click here to view the chart.
|
|
20000 character(s) left
Your answer is too long. |
|
|
Attachments |
|
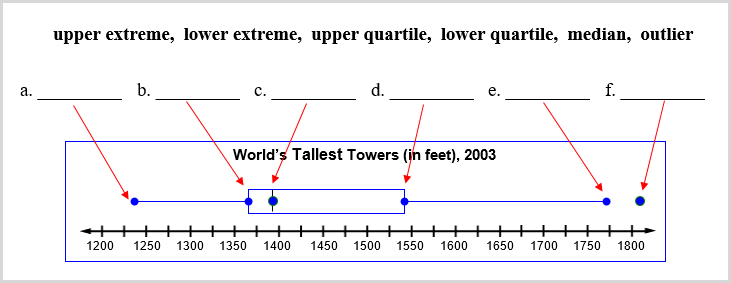
| 8) Label the parts of the box-and-whiskers plot drawn for the data in problem #1. Select from the terms given and state the letter and term for the labeled part of the graph. (Note: The outlier is graphed separately from the rest of the data; thus, the upper extreme is the next highest piece of data.)
|
 |
20000 character(s) left
Your answer is too long. |
|
|
Attachments |
|
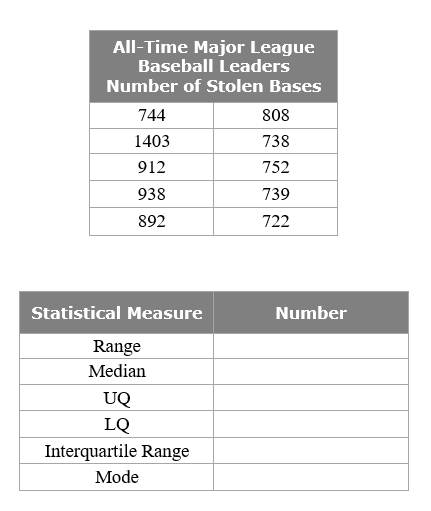
Print out the tables. Use the baseball data given in the first table to find the statistical data listed in the second table and then answer question #9 through #19.
Printable Table
|
 |
|
| |
| 9) List the numbers in order from greatest to least. |
|
4000 character(s) left
Your answer is too long. |
|
| |
|
| 10) What is the range?
|
|
4000 character(s) left
Your answer is too long. |
|
| |
|
| 11) What is the median?
|
|
4000 character(s) left
Your answer is too long. |
|
| |
|
| 12) What is the upper quartile?
|
|
4000 character(s) left
Your answer is too long. |
|
| |
|
| 13) What is the lower quartile?
|
|
4000 character(s) left
Your answer is too long. |
|
| |
|
| 14) What is the interquartile range?
|
|
4000 character(s) left
Your answer is too long. |
|
| |
|
| 15) What are the results of multiplying the interquartile range by 1.5?
|
|
4000 character(s) left
Your answer is too long. |
|
| |
|
| 16) What is the upper limit for outliers?
|
|
4000 character(s) left
Your answer is too long. |
|
| |
|
| 17) What is the lower limit for outliers?
|
|
4000 character(s) left
Your answer is too long. |
|
| |
|
| 18) Determine if there are any outliers. State the outlier.
|
|
4000 character(s) left
Your answer is too long. |
|
| |
|
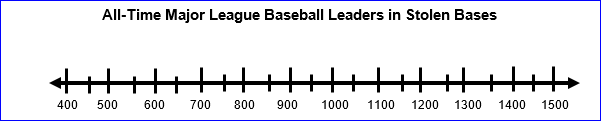
| 19) Make a box-and-whiskers plot for the baseball data.
a. Describe the rectangular area by stating the number that is below the left side of the rectangle, the number where the middle line in the rectangle is drawn, and the number that is below the right side of the rectangle.
b. Describe the whiskers by stating the number that is below the left point of the whiskers and the number that is below the right point of the whiskers.
Printable number line
|
 |
20000 character(s) left
Your answer is too long. |
|
|
Attachments |
|
Print out the chart. Exclude the outlier (do not include it in the data when making the calculations) and then find the range, median, upper quartile, lower quartile, mode, and mean of the baseball data. Use this information to answer questions #20 through #25.
Printable Chart
|
|
|
| |
| 20) What is the range?
|
|
4000 character(s) left
Your answer is too long. |
|
| |
|
| 21) What is the median?
|
|
4000 character(s) left
Your answer is too long. |
|
| |
|
| 22) What is the upper quartile?
|
|
4000 character(s) left
Your answer is too long. |
|
| |
|
| 23) What is the lower quartile?
|
|
4000 character(s) left
Your answer is too long. |
|
| |
|
| 24) What is the mode?
|
|
4000 character(s) left
Your answer is too long. |
|
| |
|
| 25) What is the mean?
|
|
4000 character(s) left
Your answer is too long. |
|
| |
|
| 26) Draw a second box-and-whiskers graph above the same number line that you used in problem #19. Make this second graph a graph of the data in which the outlier has been excluded; therefore draw the outlier as a separate point. Comparing the data in both tables and the graphs of the two box-and-whisker plots, answer the following questions:
a. Which statistical measure is most affected by excluding the outlier?
b. Which statistical measure is the next most affected by excluding the outlier?
c. Why might you want to exclude the outlier in figuring the statistical measures?
|
|
4000 character(s) left
Your answer is too long. |
|
| |
|
| |
| 27) Bill, Adele, and Richard deliver newspapers. Bill delivers 252 papers, Adele delivers 168 papers, and Richard delivers 105 papers. The newspapers are packaged in full bundles with the same number of papers in each bundle. What is the greatest number of papers that there could be in a bundle if each person receives several full bundles to deliver? (Hint: Use division and trial and error to find the number of papers in each bundle. Remember, you are looking for the greatest number of papers in each bundle with no papers left over when you divide by that number.)
|
|
4000 character(s) left
Your answer is too long. |
|
| |
|
| 28) Explain why this statement is true by writing a logical argument. Use examples as needed.
“Any even number divisible by 9 is also divisible by 6.”
|
|
20000 character(s) left
Your answer is too long. |
|
|
Attachments |
|
| 29) Is the sequence linear or nonlinear? 3, 4, 6, 9, 13, 18 ...
|
|
4000 character(s) left
Your answer is too long. |
|
| |
|
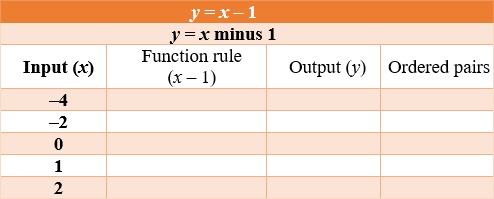
| 30) Print out and complete the table by finding the y values for the x values provided in the chart for the equation, y = x – 1. State the five ordered pairs.
Printable Table
|
 |
4000 character(s) left
Your answer is too long. |
|
| |
|
| 31) If you were directed by your school to complete Offline Activities for this course, please enter the information on the Log Entry form. |
|
| No offline activities found |
| 0 Hour(s) & 0 Minute(s) |
|
|
Attachments |
|