| 1) Types of Graphs for Display
Fill in the blank with the correct type of graph. State the letter of the statement along with the type of graph that is described.
a) __________ shows amounts of data that fall into equally-spaced intervals
b) __________ uses small pictures that represent equal amounts to compare categories of data
c) __________ shows multiple occurrences of the same data
d) __________ used to show growth or decline over a specified length of time
e) __________ provides a way to organize data quickly
f) __________ compares all categories of data in a pie chart
g) __________ used to show an amount for each category
|
|
20000 character(s) left
Your answer is too long. |
|
|
Attachments |
|
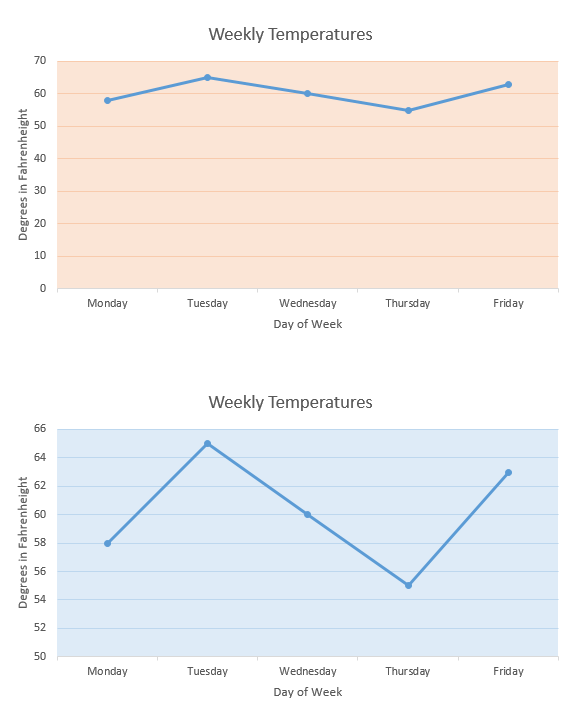
Choosing the Right Scale
Use the two graphs to answer questions #2 - #4.
|
 |
|
| |
| 2) How are the increments on the vertical axes different between the two scales?
Click here to view the graphs.
|
|
4000 character(s) left
Your answer is too long. |
|
| |
|
| 3) What are the starting and ending values of each of the two scales on the vertical axes?
Click here to view the graphs.
|
|
20000 character(s) left
Your answer is too long. |
|
|
Attachments |
|
| 4) Which graph do you think is more effective in displaying the changing temperatures for the week? Give two reasons for your answer.
Click here to view the graphs.
|
|
4000 character(s) left
Your answer is too long. |
|
| |
|
Same Data in Different Graphs
|
|
|
| |
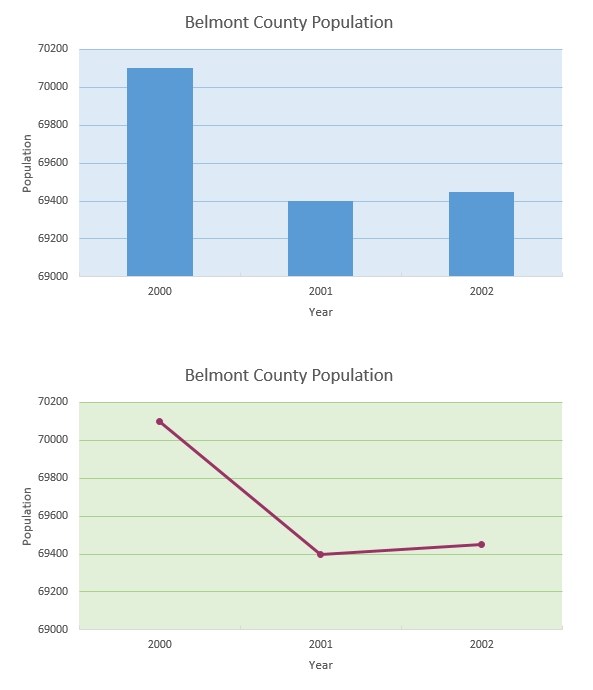
The graphs below show the same data displayed in a bar graph and in a line graph. Refer to the graphs to answer questions #5 & #6.
|
 |
|
| |
| 5) Based on the bar graph, construct a valid argument that the population is “increasing” in Belmont County. Support your argument with references to the data shown in the chart.
Click here to view the graphs.
|
|
20000 character(s) left
Your answer is too long. |
|
|
Attachments |
|
| 6) Based on the line graph, construct a valid argument that the population is “decreasing” in Belmont County. Support your argument with references to the data shown in the chart.
Click here to view the graphs.
|
|
20000 character(s) left
Your answer is too long. |
|
|
Attachments |
|
| |
| 7) What elements of this bar graph are misleading? Explain at least two.
|
 |
4000 character(s) left
Your answer is too long. |
|
| |
|
| |
| 8) Tommy is conducting a survey to determine his classmates’ favorite type of music. Which of the following groups would be an unbiased group for collecting the data: the football team or all of the students in his class whose birthday is an odd number. Please explain why you think this group is unbiased?
|
|
4000 character(s) left
Your answer is too long. |
|
| |
|
| 9) In a newspaper or magazine, pick a paragraph and find the number of times each letter of the alphabet occurs. Print out the chart and record the results.
1) For each letter, make a tally for each letter that occurs.
2) Once the tally is complete, write the number for the tally.
3) Determine the total number of letters in the paragraph.
4) Find what percent of all the letters in the paragraph each letter occurs. You may use a calculator.
State the following in the textbox below in the order requested:
1) Total number of letters in the paragraph
2) Each letter with the number of times the letter occurs, and the percent of all the letters the letter is used.
Printable Chart
|
|
20000 character(s) left
Your answer is too long. |
|
|
Attachments |
|
| 10) In a newspaper or magazine, pick a second paragraph and find the number of times each letter of the alphabet occurs. Print out the chart and record the results.
1) For each letter, make a tally for each letter that occurs.
2) Once the tally is complete, write the number for the tally.
3) Determine the total number of letters in the paragraph.
4) Find what percent of all the letters in the paragraph each letter occurs. You may use a calculator.
State the following in the textbox below in the order requested:
1) Total number of letters in the paragraph
2) Each letter with the number of times the letter occurs, and the percent of all the letters the letter is used.
Printable Chart
|
|
20000 character(s) left
Your answer is too long. |
|
|
Attachments |
|
| 11) In a newspaper or magazine, pick a third paragraph and find the number of times each letter of the alphabet occurs. Print out the chart and record the results.
1) For each letter, make a tally for each letter that occurs.
2) Once the tally is complete, write the number for the tally.
3) Determine the total number of letters in the paragraph.
4) Find what percent of all the letters in the paragraph each letter occurs. You may use a calculator.
State the following in the textbox below in the order requested:
1) Total number of letters in the paragraph
2) Each letter with the number of times the letter occurs, and the percent of all the letters the letter is used.
Printable Chart
|
|
20000 character(s) left
Your answer is too long. |
|
|
Attachments |
|
| 12) Print out the chart. Fill in the chart to compare the three samples. List the percents found for each letter in the three samples and then average them. State each letter, the three sample percentages, and the average occurrence for each letter.
Printable Chart
|
|
20000 character(s) left
Your answer is too long. |
|
|
Attachments |
|
| 13) Write a summary paragraph stating which letters you think occur most often in written text and which letters occur least often. Support your summary by referring to the results of the data you collected, organized, and analyzed in problems #9 through #12.
|
|
20000 character(s) left
Your answer is too long. |
|
|
Attachments |
|
| 14) Find a two-column article in a newspaper or magazine that has about 300 to 500 letters in it. Count the number of letters in the entire article. Based on the average percentage of the three samples, predict how many times each letter of the alphabet occurs in the article.
Printable Chart
|
|
4000 character(s) left
Your answer is too long. |
|
| |
|
| 15) Test the prediction by actually counting each of the letters in the article. Make a tally of each letter’s occurrence, and then write the number for the tally. Print out the chart to record the prediction calculated in #14, the tally, and the actual number of occurrences of each letter. State the letter, the prediction, and the actual number of occurrences.
Printable Chart
|
|
20000 character(s) left
Your answer is too long. |
|
|
Attachments |
|
Use the results for #15 to compare the predictions with the actual sampling in questions #16 - #22.
|
|
|
| |
| 16) For which letters were your predictions close to the actual?
|
|
20000 character(s) left
Your answer is too long. |
|
|
Attachments |
|
| 17) For which letters were your predictions far from the actual?
|
|
4000 character(s) left
Your answer is too long. |
|
| |
|
| 18) What were the top five letters that occurred most often?
|
|
20000 character(s) left
Your answer is too long. |
|
|
Attachments |
|
| 19) What five letters occurred least often?
|
|
20000 character(s) left
Your answer is too long. |
|
|
Attachments |
|
| 20) How could you make more accurate predictions?
|
|
4000 character(s) left
Your answer is too long. |
|
| |
|
| 21) What if you only used one sample? Would your predictions have been as accurate? Use your data to support your answer.
|
|
4000 character(s) left
Your answer is too long. |
|
| |
|
| 22) The next time you play “Wheel of Fortune”, what five letters will you choose first?
|
|
4000 character(s) left
Your answer is too long. |
|
| |
|
| 23) Go online and research how sampling is used to predict the number of wild animals in a given area or number of fish in a given body of water. Find an actual study completed and state the website that has information about the sample. Give three useful details about the sampling study.
|
|
20000 character(s) left
Your answer is too long. |
|
|
Attachments |
|
| 24) Why is sampling an important use of statistics?
|
|
20000 character(s) left
Your answer is too long. |
|
|
Attachments |
|
| |
| 25) Mr. Jones hired Tom, Dick, and Harry to rake leaves. The house has a back yard and a front yard that are about the same size. The neighbor agrees to pay the three boys $60 for the entire job. On the day of the job, Tom and Dick finished the front yard before Harry arrived. All three boys raked the back yard. How should the money be split between the boys? Each boy must be paid based on the amount of the yard he raked. Draw a picture on paper for the solution. Describe the picture and state and explain your solution.
|
|
4000 character(s) left
Your answer is too long. |
|
| |
|
| 26) Write the inequality for the graph.
|
 |
4000 character(s) left
Your answer is too long. |
|
| |
|
| 27) Solve the equation for the variable. Check answer through substitution.
–23 + k = –51
|
|
4000 character(s) left
Your answer is too long. |
|
| |
|
| 28) Find the simple interest on a loan amount of $15,000 for 3 years at 6.5% interest rate. Use I = prt.
|
|
4000 character(s) left
Your answer is too long. |
|
| |
|
| 29) Evaluate for x = –5, y = 3, and z = –2.
3y – xz
|
|
4000 character(s) left
Your answer is too long. |
|
| |
|
| 30) Is this sequence linear or nonlinear? 15, 21, 27, 33, 39, ...
|
|
4000 character(s) left
Your answer is too long. |
|
| |
|
| 31) For the data find the mean, mode, median, and range.
11 23 15 20 17 23 21 29 20 23 18
|
|
4000 character(s) left
Your answer is too long. |
|
| |
|
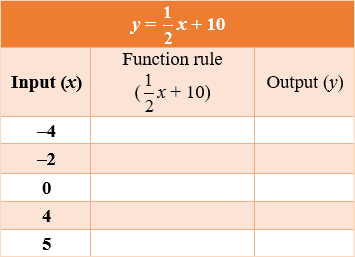
| 32) Determine the output (y) for the input (x) for the equation y = (1/2)x + 10. State the input and output values as ordered pairs.
|
 |
4000 character(s) left
Your answer is too long. |
|
| |
|
| 33) Solve this equation for p. Check through substitution.
|
 |
4000 character(s) left
Your answer is too long. |
|
| |
|
| 34) If you were directed by your school to complete Offline Activities for this course, please enter the information on the Log Entry form. |
|
| No offline activities found |
| 0 Hour(s) & 0 Minute(s) |
|
|
Attachments |
|