Statistics and Histograms
Refer to the following scenario and data to solve the first FIFTEEN problems. A sixth grade mathematics teacher recorded the following test scores for the mid-term exam: 100, 91, 85, 79, 82, 91, 67, 76, 73, 85, 88, 100, 82, 67, 82, 97, 97, 73, 85, 53, 70, 88, 94, 85, 73, and 88.
|
|
|
| |
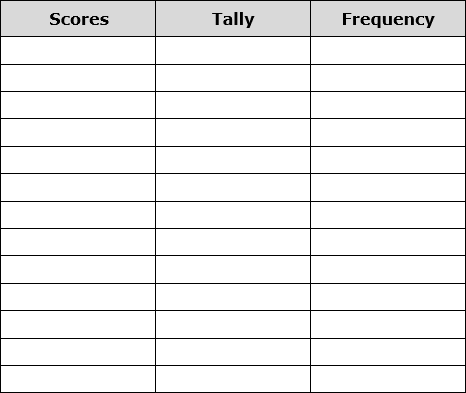
| 1) Print out the table below and organize the test scores by completing a tally and frequency for all of the different test scores. State each test score and the test score’s frequency.
Printable Statistics and Histograms Table
|
 |
20000 character(s) left
Your answer is too long. |
|
|
Attachments |
|
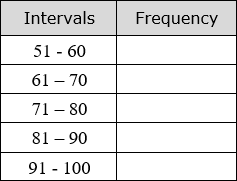
| 2) Print out the table below to organize the data collected in the previous problem by intervals. Record the frequency of each score in the appropriate interval. Tally the frequency of each interval. State each interval and the corresponding frequency.
Printable Organize_Data Table
|
 |
20000 character(s) left
Your answer is too long. |
|
|
Attachments |
|
| Draw a histogram based on the intervals and the frequencies recorded in the previous table, and then answer the next seven questions.
|
|
|
| |
| 3) What labels did you use across the horizontal axis to represent each of the bars?
|
|
20000 character(s) left
Your answer is too long. |
|
|
Attachments |
|
| 4) What scale did use for frequency along the vertical axis?
|
|
4000 character(s) left
Your answer is too long. |
|
| |
|
| 5) What is the title of the graph?
|
|
4000 character(s) left
Your answer is too long. |
|
| |
|
| 6) In what interval did most of the test scores occur?
|
|
4000 character(s) left
Your answer is too long. |
|
| |
|
| 7) In what interval did the fewest test scores occur?
|
|
4000 character(s) left
Your answer is too long. |
|
| |
|
| 8) What test score is an outlier?
|
|
4000 character(s) left
Your answer is too long. |
|
| |
|
| 9) Describe the distribution of the test scores by stating if the data is “symmetrical” or “skewed”. Explain your choice.
|
|
4000 character(s) left
Your answer is too long. |
|
| |
|
| 10) What is the mean of the test scores?
|
|
4000 character(s) left
Your answer is too long. |
|
| |
|
| 11) What is the mode of the test scores?
|
|
4000 character(s) left
Your answer is too long. |
|
| |
|
| 12) What is the median of the test scores?
|
|
20000 character(s) left
Your answer is too long. |
|
|
Attachments |
|
| 13) What is the range of the test scores?
|
|
4000 character(s) left
Your answer is too long. |
|
| |
|
| 14) Do you think the difficulty level of the test was easy, moderate, or hard? Justify your answer with evidence from the data.
|
|
4000 character(s) left
Your answer is too long. |
|
| |
|
| 15) Do you think the test was “fair”? Please explain your answer.
|
|
4000 character(s) left
Your answer is too long. |
|
| |
|
Box-and-whisker Plot
Use the following information on questions #16 - #20.
Paul planted pumpkins in his garden this year. He weighed and recorded the weight of each one. Their weights are as followed: 10, 15, 5, 13, 7, 16, 25, 20, 7, 10, 14
|
|
|
| |
| 16) What is the range or spread of the weight of the pumpkins?
|
|
4000 character(s) left
Your answer is too long. |
|
| |
|
| 17) What is the lower and upper extreme?
|
|
4000 character(s) left
Your answer is too long. |
|
| |
|
| 18) What is the median of the data?
|
|
4000 character(s) left
Your answer is too long. |
|
| |
|
| 19) What is the lower and upper quartile? |
|
4000 character(s) left
Your answer is too long. |
|
| |
|
| 20) Upload a box-and-whisker plot of the weight of the pumpkins. It can be drawn or computer made. |
|
20000 character(s) left
Your answer is too long. |
|
|
Attachments |
|
| |
| 21) Ricky is playing football and has two chances to make 9 yards so that his team can keep the ball. However, instead of gaining yards he lost 5 yards on the first play. How many yards does he have to gain on the second play so that his team may keep possession of the ball.
|
|
20000 character(s) left
Your answer is too long. |
|
|
Attachments |
|
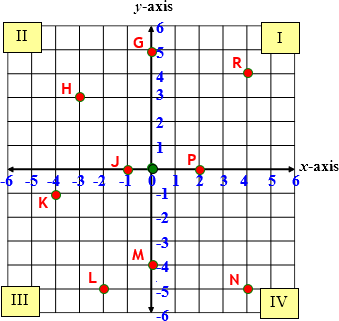
| 22) Write the ordered pairs for each of the named points.
|
 |
20000 character(s) left
Your answer is too long. |
|
|
Attachments |
|
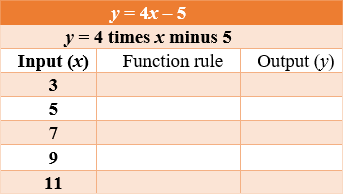
| 23) Print out the table and fill it in. State the input value and the output for each input value.
Printable Input and Output Value
|
 |
20000 character(s) left
Your answer is too long. |
|
|
Attachments |
|
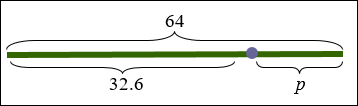
| 24) Write an equation for the diagram, and then solve.
|
 |
20000 character(s) left
Your answer is too long. |
|
|
Attachments |
|
| 25) Solve for t.
|
 |
20000 character(s) left
Your answer is too long. |
|
|
Attachments |
|
| 26) Solve for k. 30 = k – 15
|
|
4000 character(s) left
Your answer is too long. |
|
| |
|
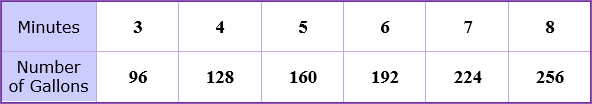
| 27) The table below shows the number of gallons of water per minute that is being pumped into a larger tank. Study the table below and state the rate of change per minute that the tank is being filled.
|
 |
4000 character(s) left
Your answer is too long. |
|
| |
|
| 28) Describe all whole numbers that will make this inequality true.
D – 7 > 2
|
|
4000 character(s) left
Your answer is too long. |
|
| |
|
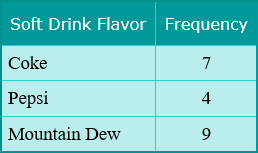
| 29) Make a circle graph for the following data, and then state the size of angle used to draw the part of the graph for each of the soft drink flavors.
|
 |
20000 character(s) left
Your answer is too long. |
|
|
Attachments |
|
| 30) Why would a circle graph be a better choice for the data in problem #29 than a line graph?
|
|
4000 character(s) left
Your answer is too long. |
|
| |
|
| 31) If you were directed by your school to complete Offline Activities for this course, please enter the information on the Log Entry form. |
|
| No offline activities found |
| 0 Hour(s) & 0 Minute(s) |
|
|
Attachments |
|