Constructing a Line Graph
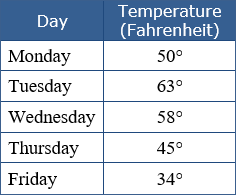
For the following scenario construct a line graph, and then answer the questions #1 through #5. Keisha recorded the daily temperatures for a week. Make a line graph on paper to show the rise and fall of temperatures for the week.
|
 |
|
| |
| 1) Name the title for the graph, subtitle for the horizontal axis, and the subtitle for the vertical axis.
|
|
4000 character(s) left
Your answer is too long. |
|
| |
|
| 2) For the scale along the vertical axis, list the range of data and list all the intervals (equal spaces) along the vertical axis.
|
|
20000 character(s) left
Your answer is too long. |
|
|
Attachments |
|
| 3) What was the highest temperature for the week?
|
|
20000 character(s) left
Your answer is too long. |
|
|
Attachments |
|
| 4) Describe the change over time that the graph displays.
|
|
20000 character(s) left
Your answer is too long. |
|
|
Attachments |
|
| 5) Predict the temperature for Saturday and give a reason for your prediction.
|
|
20000 character(s) left
Your answer is too long. |
|
|
Attachments |
|
Constructing a Circle Graph
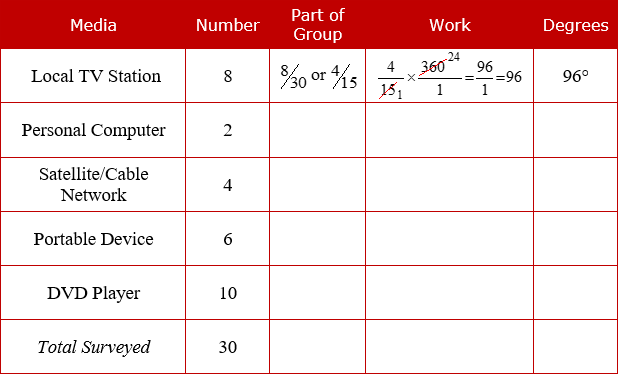
Micah surveyed his classmates to find out what type of media his classmates used to view movies. The results of his survey are shown below along with some calculations. Print out or copy the chart, perform all calculations, and complete the chart. Use the calculations in the chart to make a circle graph on paper showing each type of media as a portion of the whole group surveyed. After completing the chart and circle graph, answer questions #6 through #10.
Printable Graph
|
 |
|
| |
| 6) Each media is what fractional part of the whole group? State the fractional parts for (a) Personal Computer, (b) Satellite/Cable Network, (c) Portable Device, and (d) DVD Player. (For example: Local TV Station would be 8/30 or 4/15).
|
|
20000 character(s) left
Your answer is too long. |
|
|
Attachments |
|
| 7) What is the number of degrees for the part of the circle that matches each media? State the degrees for (a) Personal Computer, (b) Satellite/Cable Network, (c) Portable Device, and (d) DVD Player. (For example: Local TV Station would 96 degrees).
|
|
4000 character(s) left
Your answer is too long. |
|
| |
|
| 8) What are the totals of (a) the entire group as a fraction (last row in chart, third column) and (b) the entire group in degrees (last row in chart, fifth column)?
|
|
4000 character(s) left
Your answer is too long. |
|
| |
|
| 9) Which type of media is most often used in the home for viewing movies?
|
|
|
|
| |
|
| 10) Ten years from now, how may the overall graph of the media types be different? Give a reason for your answer.
|
|
20000 character(s) left
Your answer is too long. |
|
|
Attachments |
|
Constructing a Frequency Table and Histogram
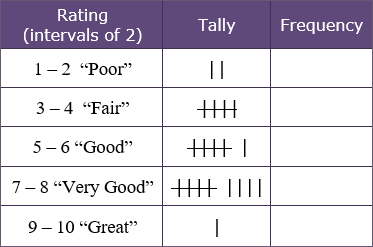
Use the following scenario to answer questions #11 through #15. Randy surveyed his friends to find out how well they liked the food served in the cafeteria. He gave his classmates a choice of rating the food from 1 to 10 with 10 meaning that the cafeteria food is “great” and 1 meaning the cafeteria food is “poor”. He organized the data in the chart below. Construct a histogram on paper for the data, and then answer the questions below.
|
 |
|
| |
| 11) What is the frequency of each interval of data? State the interval and then the frequency.
|
|
20000 character(s) left
Your answer is too long. |
|
|
Attachments |
|
| 12) What labels did you use across the horizontal axis to represent each of the bars?
|
|
4000 character(s) left
Your answer is too long. |
|
| |
|
| 13) What scale did you use for the frequency along the vertical axis? Correct Answer: Students should count by 1 or 2 up the vertical axis.
|
|
4000 character(s) left
Your answer is too long. |
|
| |
|
| 14) Are the responses balanced across the bars? Please explain your answer by stating where the concentration of responses lies?
|
|
20000 character(s) left
Your answer is too long. |
|
|
Attachments |
|
| 15) List what questions that could be asked of the students to provide feedback for the cafeteria cooks so that the survey could show more favorable responses?
|
|
20000 character(s) left
Your answer is too long. |
|
|
Attachments |
|
| 16) Evaluate the following expression for the given values.
|
 |
4000 character(s) left
Your answer is too long. |
|
| |
|
| 17) Apply the associative property by adding parentheses around two of the numbers in the expression to make the addition in the problem easier to do mentally. (a) What is the expression with the parenthesis included? (b) What is the value of the expression?
17 + 11 + 9 + 30
|
|
4000 character(s) left
Your answer is too long. |
|
| |
|
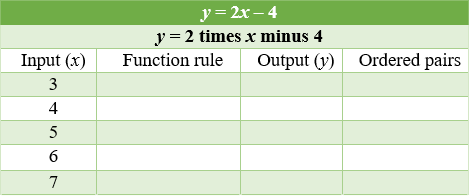
| 18) Print out or copy the table and fill in the function rule, the output, and the ordered pairs. State ordered pairs for each input value.
Printable Function Rule
|
 |
20000 character(s) left
Your answer is too long. |
|
|
Attachments |
|
| 19) Print out the coordinate plane. Graph three of the ordered pairs for the function in exercise 18. Draw a line through the three points. State the ordered pair for the point where the line crosses the x-axis.
Printable Coordinate Plane
|
|
4000 character(s) left
Your answer is too long. |
|
| |
|
| 20) Study the scales and then state the number for the question mark that makes the equation true.
|
 |
4000 character(s) left
Your answer is too long. |
|
| |
|
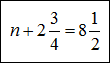
| 21) Solve the equation for “n”.
|
 |
4000 character(s) left
Your answer is too long. |
|
| |
|
| 22) Solve the equation for “q”.
|
 |
4000 character(s) left
Your answer is too long. |
|
| |
|
| 23) Solve the equation for “t ”.
|
 |
4000 character(s) left
Your answer is too long. |
|
| |
|
| 24) Solve the given inequality. Limit the answers to the whole numbers. {0, 1, 2, 3, 4 ...}. State the whole numbers that will make the inequality a true statement.
|
 |
4000 character(s) left
Your answer is too long. |
|
| |
|
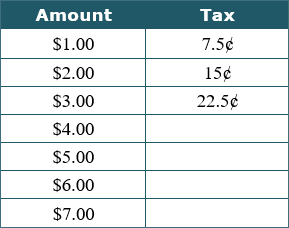
| 25) Print out or copy the given table and complete the missing tax amounts. State the tax for each amount. Look over the taxes for each amount and then state the rate of change per dollar.
Printable Tax Table
|
 |
4000 character(s) left
Your answer is too long. |
|
| |
|
| 26) If you were directed by your school to complete Offline Activities for this course, please enter the information on the Log Entry form. |
|
| No offline activities found |
| 0 Hour(s) & 0 Minute(s) |
|
|
Attachments |
|