Using Probabilities to Make A Fair Decision
For the following problems, use the following scenario. A teacher wants to select 5 of the 26 students in her class to work out a problem on the board. Determine whether the strategy would result in a fair or unfair decision.
|
|
|
| |
| 1) The names of all the students are written on a paper and drawn from a hat. The first five names drawn will work the board. |
|
4000 character(s) left
Your answer is too long. |
|
| |
|
| |
|
| |
|
| |
|
| 5) Two players take turns tossing two coins. Player 1 scores a point when both coins are the same, that is either a head/head or tail/tail. Player 2 scores a point when the two coins are different, that is either a head/tail or a tail/head. Determine whether the game is fair. Explain why or why not.
|
|
20000 character(s) left
Your answer is too long. |
|
|
Attachments |
|
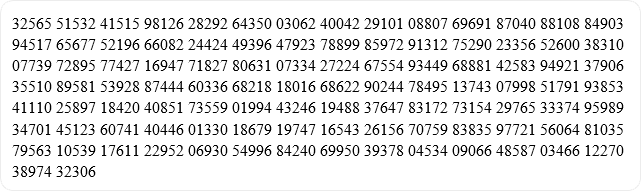
| 6) There are 32 members in the advanced senior government class at North High School. The government teacher wants to select 6 students to attend a leadership conference. He assigns a two digit number from 01 to 32 to each student. Use the first line of the random number table to determine the numbers of the students who will attend the conference.
Hint: Review Example 6 before you submit your answers. |
 |
4000 character(s) left
Your answer is too long. |
|
| |
|
Using Probability to Analyze Decisions
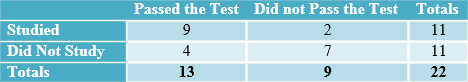
The following table shows the number of student who studied or did not study for an algebra test and whether they passed or did not pass the test. Use the table for the following problems.
|
 |
|
| |
| 7) What is the probability that a student passed the test after studying for the test?
Hint: Look at the data for the students who studied for the test.
|
|
4000 character(s) left
Your answer is too long. |
|
| |
|
| 8) What is the probability that a student did not pass the test after not studying for the test? |
|
4000 character(s) left
Your answer is too long. |
|
| |
|
| 9) What conclusion can a student make about studying for their algebra test?
|
|
4000 character(s) left
Your answer is too long. |
|
| |
|
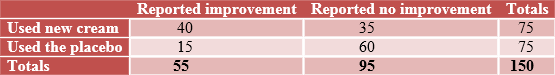
A pharmaceutical company wants to test the effectiveness of a new cream to treat a skin rash. Of the 150 volunteers for the trial, 75 used the new cream and 75 used a placebo. After a week, the volunteers were asked if they noticed improvement. The results are displayed in the table below. Use the table for the following problems.
|
 |
|
| |
| 10) What is the probability that a volunteer reported improvement, given that he or she received the treatment?
|
|
4000 character(s) left
Your answer is too long. |
|
| |
|
| 11) What is the probability that a volunteer reported no improvement, given that he or she received the treatment? |
|
4000 character(s) left
Your answer is too long. |
|
| |
|
| 12) Based on the results of the test, should the company produce and market the drug as an effective treatment for skin rashes. Explain. |
|
4000 character(s) left
Your answer is too long. |
|
|
Attachments |
|
Survey Experiments and Observational Studies
For the following problems, determine whether the survey is biased or unbiased.
|
|
|
| |
| 13) A box contains the name of every student in the school. One hundred names are drawn from the box and students are asked their opinion of the new pizza served in the cafeteria.
|
|
|
|
| |
|
| 14) Every tenth person leaving the grocery store is asked who they will vote for in the upcoming election.
|
|
|
|
| |
|
| 15) Asking every tenth person leaving a baseball stadium about their favorite baseball team.
|
|
|
|
| |
|
For the following problems, determine whether the situation, describes a survey, an experiment or an observational study.
|
|
|
| |
| 16) Students in a biology class record the height of corn stalks twice a week.
|
|
|
|
| |
|
| 17) Find 100 students, half of whom play sports and compare the grade point average of the students who play sports with the students who do not play sports.
|
|
|
|
| |
|
| 18) Student council members ask every tenth person in the lunch line to name their favorite cafeteria meal.
|
|
|
|
| |
|
| 19) A scientist wants to test a new plant food. Ten seeds are planted in the same location. Half of the plants are given the plant food and the other plants are given no plant food. The scientist records the height of the plants each day.
|
|
|
|
| |
|
| |
| |
|
| |
|
| |
|
| Measure of Central Tendency
For the following problems, use the data below.
76, 85, 43, 120, 58, 180, 95, 215,136 |
|
|
| |
| |
|
| |
|
| |
|
For the following problems, use the data below.
The temperatures (in °F) recorded in Columbus at noon on each day for two weeks were as follows:
81, 78, 77, 75, 80, 82, 84, 78, 74, 75, 49, 71, 76, 80
|
|
|
| |
| |
|
| |
|
| |
|
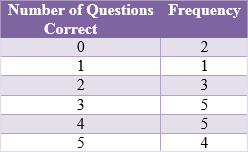
Use the frequency table for the following problems.
The students in a class of 20 were given an algebra quiz with 5 questions The frequency table below shows the number of questions each student got correct. Find the mean, median and mode of the quiz scores.
Hint: Remember to use all 20 scores when calculating the mean and median.
|
 |
|
| |
| |
|
| |
|
| |
|
| |
| |
|
| |
|
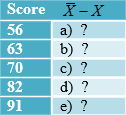
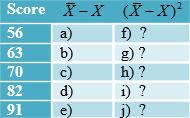
Use the data below to calculate the mean, variance, and standard deviation for the following 5 test scores. Use the table below to record your steps.
Test scores: 56, 63, 70, 82, 91
|
|
|
| |
| |
|
| 35) Find the difference between each value in the set of data and the mean. Record the results in the second column of the table below.
Hint: Subtract each score from the mean.
|
 |
20000 character(s) left
Your answer is too long. |
|
|
Attachments |
|
| 36) Square each difference. Record the results in the third column of the table. Type your answers in the box below.
Hint: Square your answers from a, b, c, d, and e in the previous question to find the answers for f, g, h, i, and j.
|
 |
20000 character(s) left
Your answer is too long. |
|
|
Attachments |
|
| |
|
| |
|
Normal Distributions
For the following problems, use the information below.
A normal distribution has a mean of 85 and a standard deviation of 10.
|
|
|
| |
| |
|
| |
|
| |
|
42) A normal distribution has a mean of 70 and a standard deviation of 8. Find the probability that a value selected at random is in each of the given intervals.
a) from 62 to 70
b) from 46 to 62
c) from 62 to 86
d) less than 78
Hint: Replace the numbers in the problem with the number of standard deviations they are from the mean, and then calculate the percentage of values that fall within that range of standard deviations using the image in the unit reading. |
|
20000 character(s) left
Your answer is too long. |
|
|
Attachments |
|
| 43) Extended Learning
Watch the following video, then write a five-sentence paragraph summarizing the video.
|
|
20000 character(s) left
Your answer is too long. |
|
|
Attachments |
|
| 44) If you were directed by your school to complete Offline Activities for this course, please enter the information on the Log Entry form. |
|
| No offline activities found |
0 Hour(s) & 0 Minute(s)
|
|
|
Attachments |
|