|
Print out copies of graph paper, as needed, to complete the graphing assignments. There is a link to graph paper in the content area of this unit. |
|
|
| |
|
Graphing Quadratic Equations |
|
|
| |
| 1) Select the BEST choice that completes the following statements. The graph of a quadratic function with a minimum value opens __________. The graph of a quadratic function with a maximum value opens __________. |
|
|
|
| |
|
| 2)
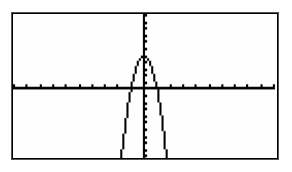
For the given quadratic function shown in the graph, the parabola has what type of vertex and what is the axis of symmetry? |
 |
|
|
| |
|
| 3)
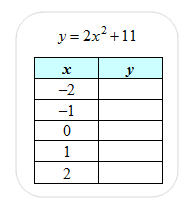
Complete the table of values for the given function and graph the function. Connect the points using a curve. (a) What is the ordered pair of the vertex? (b) Is the parabola opening upward or downward?
|
 |
4000 character(s) left
Your answer is too long. |
|
| |
|
| |
|
| |
|
| 6)
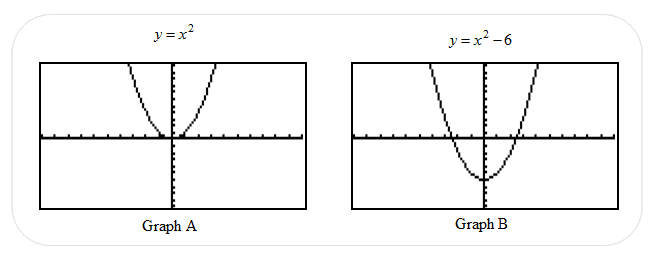
Compare Graphs A and B and their functions. Graph B has been translated vertically how many units and in what direction? |
 |
4000 character(s) left
Your answer is too long. |
|
| |
|
| |
|
| 8)
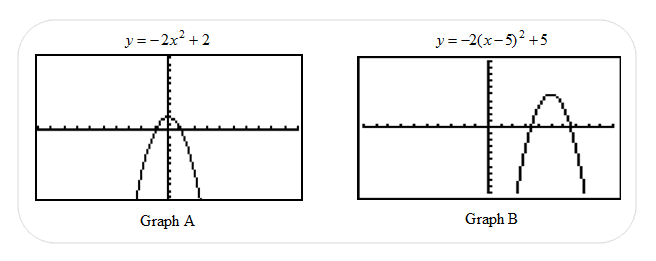
Compare Graphs A and B and their functions. Graph B has been translated (a) vertically how many units and in what direction and (b) horizontally how many units and in what direction? |
 |
4000 character(s) left
Your answer is too long. |
|
| |
|
|
Solving Equations Using Squares and Square Roots |
|
|
| |
| |
|
| |
|
| |
|
| |
|
| |
|
| 14)
Solve for “x”. |
 |
|
|
| |
|
| 15)
An amusement park ride, the Demon Drop, includes a descent of 99 feet. Use the given equation to approximate the time (seconds) that it takes the dropped object to fall a distance of 99 feet. Select the closest answer. |
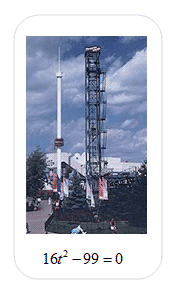 |
|
|
| |
|
|
Direct and Inverse Variation |
|
|
| |
| 16)
Complete the table by determining the y-values that correspond to the given x-values. Based on the values displayed in the table, as x increases, y varies ________ to x. |
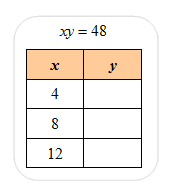 |
|
|
| |
|
| 17)
Refer to the equation and table shown below to complete the table, solving for the y-values that correspond to the given x-values. Based on the values displayed in the table, as x increases, y varies ________ to x. |
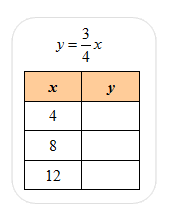 |
|
|
| |
|
| |
|
| 19)
Which equation shows that as the time increases, the rate will decrease, and the distance remains constant? (inverse variation) |
|
|
|
| |
|
|
Exponential Growth and Decay |
|
|
| |
| 20)
Which set of numbers shows that y varies directly to x? (y = kx) |
|
|
|
|
|
|
|
| |
|
| 21)
Select the BEST choice that completes the following sentences about exponential functions. When the value of the variable exponent increases and the value of the function increases, then exponential ________ occurs; but, if the value of the function decreases as the value of the variable exponent increases, then exponential ________ occurs. |
|
|
|
| |
|
| 22)
What type of exponential function is shown in the graph? |
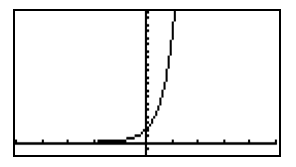 |
|
|
| |
|
| 23)
What type of exponential function is shown in the graph? |
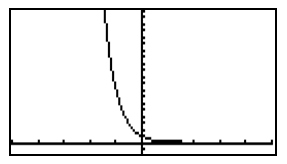 |
|
|
| |
|
| 24)
Complete the table of values for the given function. Graph the ordered pairs connecting the points with a smooth curve. List the ordered pairs, and then state whether the exponential function shows exponential growth or exponential decay. |
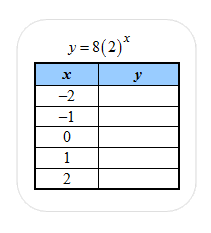 |
4000 character(s) left
Your answer is too long. |
|
| |
|
| |
|
| |
|
| |
|
| |
|
|
Perfect Cubes and Their Cube Roots |
|
|
| |
| |
|
| |
|
| |
|
| |
|
| |
|
| 34) If you were directed by your school to complete Offline Activities for this course, please enter the information on the Log Entry form. |
|
| No offline activities found |
0 Hour(s) & 0 Minute(s)
|
|
|
Attachments |
|