|
Same Data in Different Graphs |
|
|
| |
|
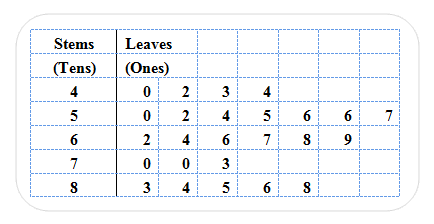
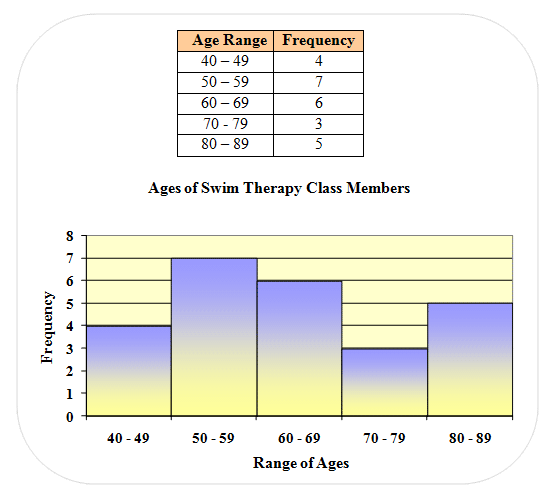
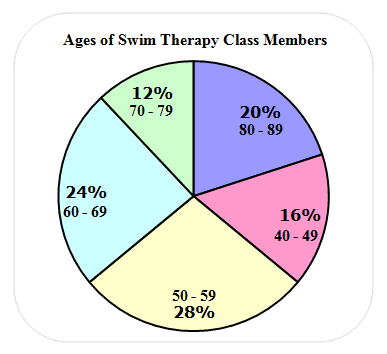
Iola, the swim therapy instructor, organized the ages of her class members in a stem-and-leaf plot. She then determined the frequency, based on ranges of age, and displayed the results in both a histogram and a circle graph. Look over the charts and graphs below, and then answer the next two questions. |
|
|
| |
|
Iola used a STEM-AND-LEAF PLOT to organize the numerical data based on the ages of the participants. |
 |
|
| |
|
Iola used a FREQUENCY CHART to determine the number of occurrences of the participants’ ages in each age range. She then displayed the frequency of the age intervals in a HISTOGRAM. |
 |
|
| |
|
Iola displayed the age categories in a CIRCLE GRAPH to compare distribution of the age ranges to the whole group. |
 |
|
| |
| 1)
In which display of data can Iola see every person’s age? |
|
|
|
| |
|
| 2)
Which two age-groups had more participants than the other three groups combined? |
|
|
|
| |
|
| |
| 3)
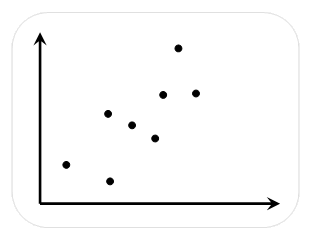
What type of correlation does the scatter plot display? |
 |
|
|
| |
|
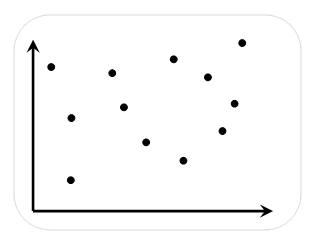
| 4)
What type of correlation does the scatter plot display? |
 |
|
|
| |
|
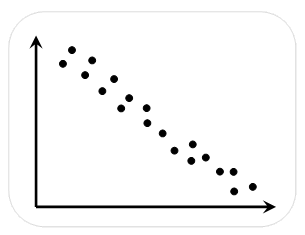
| 5)
What type of correlation does the scatter plot display? |
 |
|
|
| |
|
|
For the next four questions, determine whether a scatter plot of the data would show a positive, a negative, or no correlation. (Think: As the data in the first category changes, how will the corresponding data in the second category be affected, if at all.) |
|
|
| |
| 6)
Calorie consumption, Weight |
 |
|
|
| |
|
| 7)
Hair color, Intelligence |
 |
|
|
| |
|
| 8)
Birth weight, Month of birth |
|
|
|
| |
|
| 9)
Miles driven on a motorcycle, Thickness of the tire tread |
 |
|
|
| |
|
|
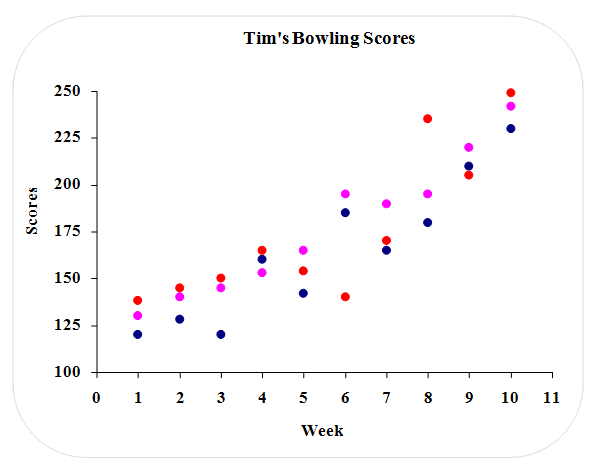
Tim bowls in a league over a 10-week period, and then enters tournament playoffs. The scores of his three games played each week are displayed in the scatter plot shown below. Refer to the graph to answer the next three questions.
Click to the the scatter plot in a pop-up window.
|
 |
|
| |
| 10)
What type of correlation does the scatter plot show? |
|
|
|
| |
|
| 11)
True or False. The graph suggests that Tim’s scores remained about the same over time. |
|
|
|
| |
|
| 12)
Is it likely that Tim will score a 255 in tournament play? Justify the answer with information gathered from the graph. |
|
4000 character(s) left
Your answer is too long. |
|
|
Attachments |
|
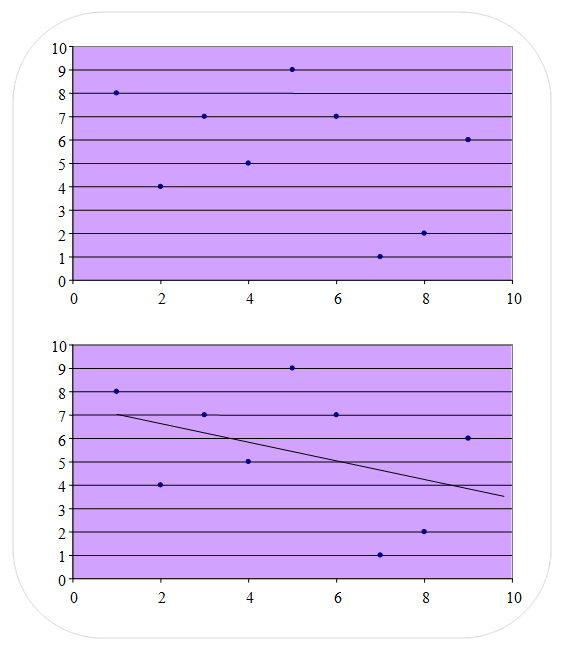
| 13)
In the first scatter plot shown below, the data appears to have no correlation. However, in the second scatter plot (which is the same scatter plot as the first one), a “line of best fit” is added. The line of best fits indicates what type of correlation exists? |
 |
|
|
| |
|
| 14)
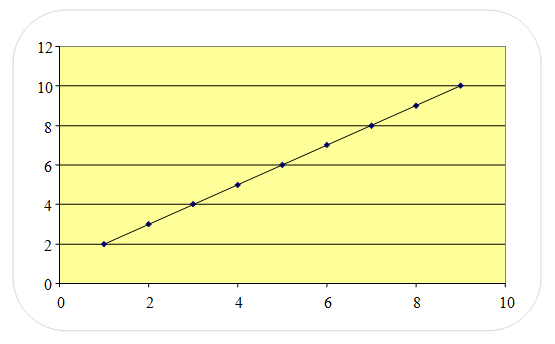
In the scatter plot shown below, the “line of best fit” passes through EVERY point; therefore, the graph is considered to be: |
 |
|
|
| |
|
| |
|
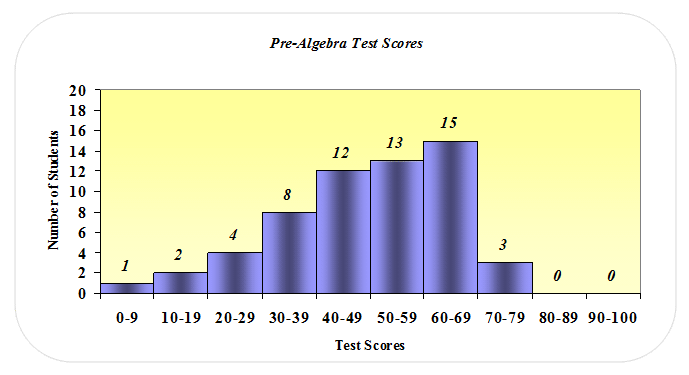
Use the histogram shown below to solve the next two problems. |
 |
|
| |
| |
|
| 16)
How does this graph help the teacher interpret the results of this test? |
|
4000 character(s) left
Your answer is too long. |
|
|
Attachments |
|
|
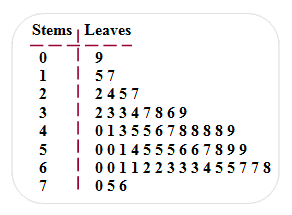
The stem-and-leaf plot shown below is based on the same test score data that is displayed in the histogram above. Refer to the stem-and-leaf plot to answer the next two questions. |
 |
|
| |
| 17)
What information is provided in the stem-and-leaf plot that is not provided in the histogram? |
|
4000 character(s) left
Your answer is too long. |
|
|
Attachments |
|
| 18)
What information about the test results is more easily derived when the data is displayed in the histogram? |
|
4000 character(s) left
Your answer is too long. |
|
|
Attachments |
|
| |
| 19)
Define “simple random sample” and provide an example. |
|
4000 character(s) left
Your answer is too long. |
|
|
Attachments |
|
| 20)
Define “stratified random sample” and provide an example. |
|
4000 character(s) left
Your answer is too long. |
|
|
Attachments |
|
| 21)
Define “systematic random sample” and provide an example. |
|
4000 character(s) left
Your answer is too long. |
|
|
Attachments |
|
| 22)
Define “convenience sample” and provide an example. |
|
4000 character(s) left
Your answer is too long. |
|
|
Attachments |
|
| 23)
Define “voluntary response sample” and provide an example. |
|
4000 character(s) left
Your answer is too long. |
|
|
Attachments |
|
| 24)
Which type of sample is biased? |
|
|
|
| |
|
| 25)
Which type of sample is unbiased? |
|
|
|
| |
|
| 26)
To evaluate the quality of their product, Ford pulls every one hundredth car off the production line to check for defects. This is an example of what type of sample? |
|
|
|
| |
|
| 27)
The football players of the local professional football team were surveyed to see what type of energy drink they preferred. This is an example of what type of sample? |
 |
|
|
| |
|
| 28)
To determine the most popular brand of cosmetics, Teen Magazine asks its readers to complete a questionnaire and send it back to the magazine to get a 10% discount on next year’s subscription. This is an example of what type of sample? |
 |
|
|
| |
|
| 29)
Suppose you are an employee in the marketing department of Mamma Mia’s Pizzeria. Your job is to conduct a survey to determine customer satisfaction with Mamma Mia’s pizza. (a) Describe an unbiased way to conduct your survey. (b) Describe a biased way to conduct your survey. |
 |
4000 character(s) left
Your answer is too long. |
|
|
Attachments |
|
|
Read the following scenario, and then answer the next two questions: Suppose you are a Super Store “door greeter”. You have been given the task to ask every tenth person that enters the store, up through the first 100 customers, if they are satisfied with a new line of clothing that the store is carrying. After completing the task, you report that the results are unfavorable. Your manager decides that these results are unacceptable. She assigns you a second task of conducting a different survey; but this time, you are to ask every fifth person that enters the store, up through the first 300 customers, if they are satisfied with the new line of clothing. Your manager’s intuition is correct and the results of the second survey are favorable. |
|
|
| |
| |
|
| 31)
If 1000 customers were surveyed, would the outcome be favorable or unfavorable? Support your answer with information gathered from the given scenario. |
|
4000 character(s) left
Your answer is too long. |
|
|
Attachments |
|
| |
| 32)
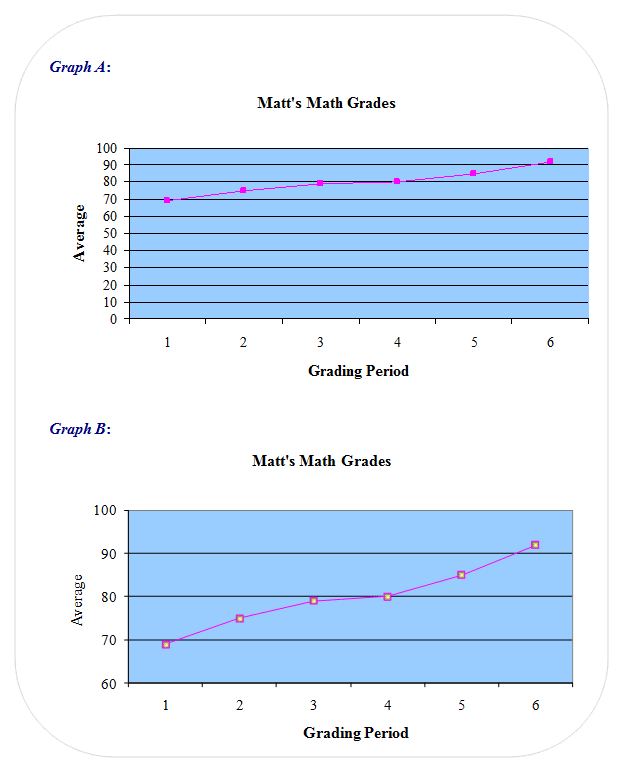
Matt made the two line graphs of his math grades for each grading period shown below. He decided to show his parents the second graph because it displayed a strong improvement in his grades. What change(s) did Matt make in his second graph so that he could enhance his gradual improvement in his grades? |
 |
4000 character(s) left
Your answer is too long. |
|
|
Attachments |
|
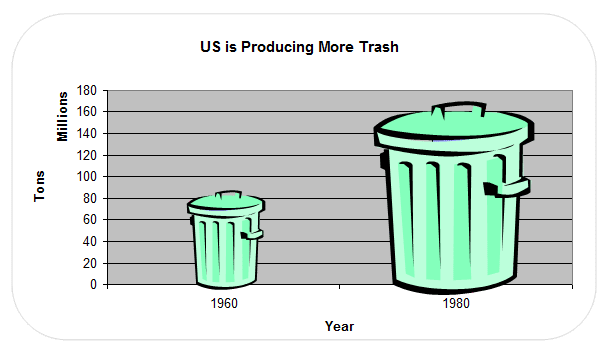
| 33)
Study the graph below and compare the amount of trash that the US produced in 1960 to the amount of trash that was produced in 1980. Compare the amounts numerically, and then compare the pictures in the graph. What is misleading about the graph? |
 |
4000 character(s) left
Your answer is too long. |
|
|
Attachments |
|
| 34) If you were directed by your school to complete Offline Activities for this course, please enter the information on the Log Entry form. |
|
| No offline activities found |
0 Hour(s) & 0 Minute(s)
|
|
|
Attachments |
|