| |
| 1)
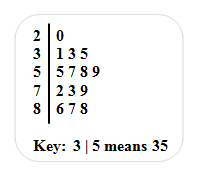
For the stem-and-leaf plot shown below, list the numbers in the data set. |
 |
4000 character(s) left
Your answer is too long. |
|
| |
|
| |
|
|
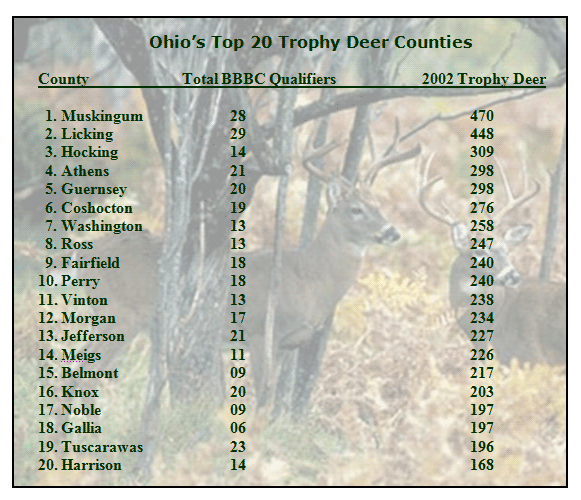
The November 2004 issue of the magazine “Ohio Game and Fish” included an article that predicted the outlook of Ohio’s top 20 trophy deer counties for the 2004 whitetail deer-hunting season. The counties were ranked by several factors including the 2002 trophy deer qualifiers and the number of deer that qualified for the “Buckeye Big Buck Club” as shown in the table below. Use the table to create a basic stem-and-leaf plot of the total BBBC qualifiers, and then answer the next five questions. |
 |
|
| |
| |
|
| |
|
| |
|
| 6)
What county or counties have the same number of qualifiers as the mode of the data? |
|
4000 character(s) left
Your answer is too long. |
|
| |
|
| 7)
What counties are included in the “20 – 29” interval in the stem-and-leaf plot created for the data? |
|
4000 character(s) left
Your answer is too long. |
|
| |
|
|
Back-to-Back Stem-and-Leaf Plots |
|
|
| |
|
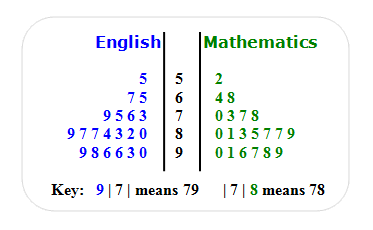
Miss Bee taught mathematics and English to the same class. She recorded the results of the most recent test scores of each subject area in the back-to-back stem-and-leaf plot shown below. Refer to the data to answer the next four questions.
Click to see the stem-and-leaf plot in a pop-up window.
|
 |
|
| |
| |
|
| |
|
| 10)
True or False. The mode of both tests is 87. |
|
|
|
| |
|
| 11)
Calculate the mean, median, and mode (central measures of tendency) for each test, and use the information gather to answer the following question: In which subject did the class do better on the test? Give a reason to support the data referring to at least one of the three measures of central tendency. |
|
4000 character(s) left
Your answer is too long. |
|
|
Attachments |
|
|
Measures of Central Tendency |
|
|
| |
| 12)
Define mean, median, and mode. |
|
4000 character(s) left
Your answer is too long. |
|
|
Attachments |
|
|
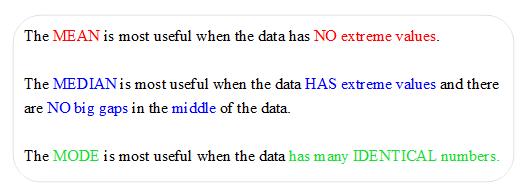
Different circumstances determine which of the measures of central tendency are most useful. |
 |
|
| |
| 13)
Which measure of central tendency is most useful for this set of data? |
 |
|
|
| |
|
| 14)
Which measure of central tendency is most useful for this set of data? |
 |
|
|
| |
|
| 15)
Which measure of central tendency is most useful for this set of data? |
 |
|
|
| |
|
| 16)
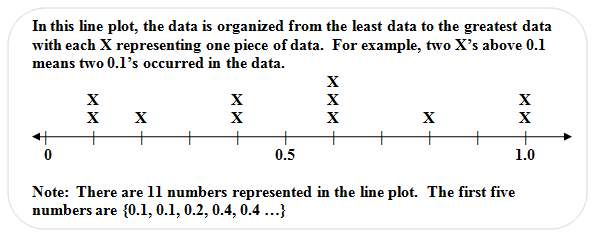
Refer to the line plot shown below and find the mean, median, and mode for the given set of data. Give the answers rounded to the nearest tenth. |
 |
4000 character(s) left
Your answer is too long. |
|
| |
|
| |
|
| |
| 18)
Define range. |
|
4000 character(s) left
Your answer is too long. |
|
|
Attachments |
|
| 19)
Define lower quartile (1st Quartile). |
|
4000 character(s) left
Your answer is too long. |
|
|
Attachments |
|
| 20)
Define upper quartile (3rd Quartile). |
|
4000 character(s) left
Your answer is too long. |
|
|
Attachments |
|
| 21)
Define outlier. |
|
4000 character(s) left
Your answer is too long. |
|
|
Attachments |
|
| |
| |
|
| |
|
| 24)
Are any of the game scores the same as the median score? |
|
|
|
| |
|
| |
|
| |
|
| |
|
| 28)
True or False. The score of 89 is an outlier. |
|
|
|
| |
|
| |
| |
|
| |
|
| |
|
| |
|
| |
|
| 34) If you were directed by your school to complete Offline Activities for this course, please enter the information on the Log Entry form. |
|
| No offline activities found |
0 Hour(s) & 0 Minute(s)
|
|
|
Attachments |
|