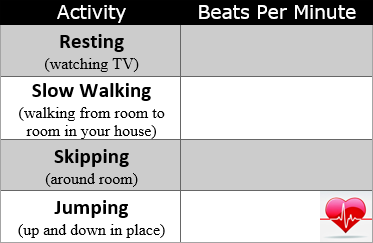
Practice finding your heartbeat by placing your index and middle finger on the top part of your wrist. You will feel the throb of your heartbeat.
Click here to print out the table and record the number of heartbeats for 60 seconds immediately after doing the activity for a few minutes.
|
 |
|
| |
| 1) How many beats per minute does your heart beat while resting? |
|
4000 character(s) left
Your answer is too long. |
|
| |
|
| 2) How many beats per minute does your heart beat after walking slowly for a few minutes? |
|
4000 character(s) left
Your answer is too long. |
|
| |
|
| 3) How many beats per minute does your heart beat after skipping for a few minutes? |
|
4000 character(s) left
Your answer is too long. |
|
| |
|
| 4) How many beats per minute does your hear beat after jumping for a few minutes? |
|
4000 character(s) left
Your answer is too long. |
|
| |
|
| 5) Make a line graph on paper to examine the results of your data plotting the activity on the horizontal axis by the number of heart beats on the vertical axis. Describe the graph. |
|
20000 character(s) left
Your answer is too long. |
|
|
Attachments |
|
| 6) Look over the graph and predict how fast your heart will beat after running very fast. Test your prediction by actually running and counting the heart beats.
Prediction ________________ Actual __________________ |
|
4000 character(s) left
Your answer is too long. |
|
| |
|
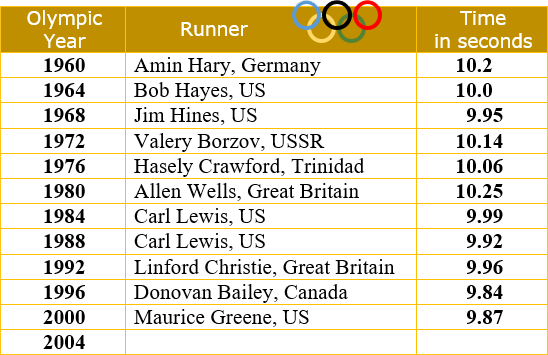
| 7) The chart below shows the results of the winners of the men’s Olympic Gold Medal for the 100-meter dash up through the year 2000. Predict the fastest time for the 100-meter dash in the 2004 Olympics. Search the Internet to find the actual time recorded at the 2004 Olympics to win the 100-meter dash and the person who achieved the Gold Medal for this accomplishment. (a) What was your prediction? (b) Who won the 2004 Olympic Gold Medal for the 100-meter dash? (c) What was the time recorded by this person for the 100-meter dash?
|
 |
4000 character(s) left
Your answer is too long. |
|
| |
|
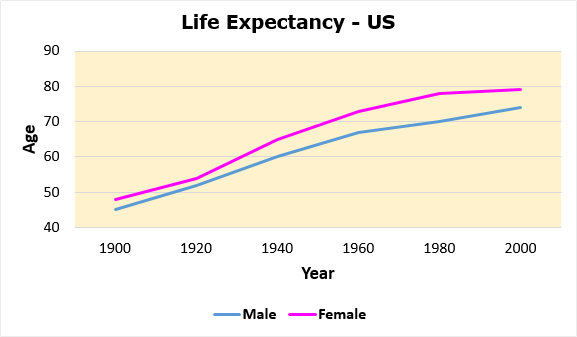
People in the United States are living longer. Study the data presented in the chart and then answer questions #8 through #10.
|
 |
|
| |
| 8) Who has a longer life expectancy? |
|
|
|
| |
|
| 9) During what years was the life expectancy closest between males and females? |
|
|
|
| |
|
| 10) By the year 2020, what do you think the life expectancy age will be? Explain how you decided upon your answer. |
|
4000 character(s) left
Your answer is too long. |
|
| |
|
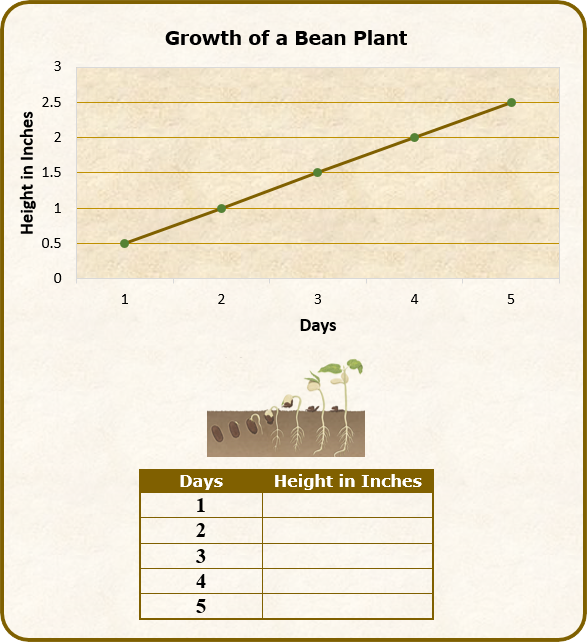
Below is a graph of the growth rate of Dustin’s bean plant once it broke through the soil. Study the data. Click here to print out the table and fill it in based on the data presented in the graph and then answer questions #11 and #12.
|
 |
|
| |
| 11) State the day and the height for Days 1 through 5. |
|
4000 character(s) left
Your answer is too long. |
|
| |
|
| |
|
| |
|
| |
|
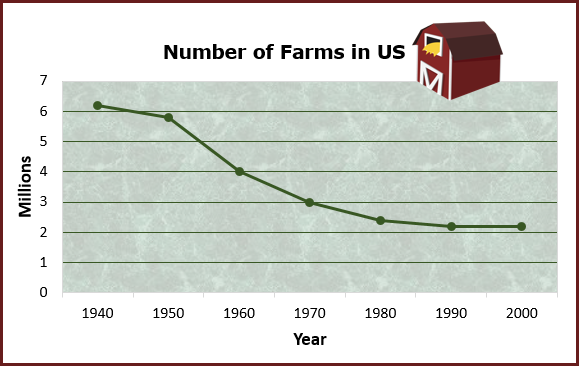
This chart shows the number of farms in the United States over the past 60 years. Study the graph and then answer questions #15 and #16.
|
 |
|
| |
| |
|
| |
|
| |
| |
|
| 18) Write a description to your friend Steven on how to draw the figure shown. Don’t use any pictures in your description.
|
 |
20000 character(s) left
Your answer is too long. |
|
|
Attachments |
|
| |
|
| |
|
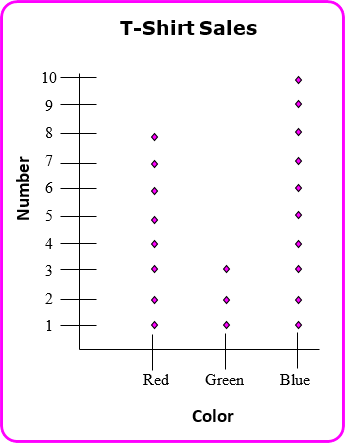
| 21) What kind of graph is shown below and state how many of each color of shirts were sold?
|
 |
4000 character(s) left
Your answer is too long. |
|
| |
|
| |
|
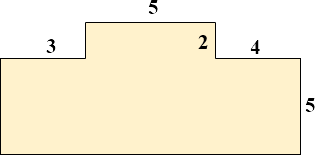
| 23) Create another figure with a different shape that has the same area as the given figure. Describe your shape and explain how you know that your drawing has the same area as the figure below.
|
 |
20000 character(s) left
Your answer is too long. |
|
|
Attachments |
|
| |
|
| |
|
| 26) If you were directed by your school to complete Offline Activities for this course, please enter the information on the Log Entry form. |
|
| No offline activities found |
| 0 Hour(s) & 0 Minute(s) |
|
|
Attachments |
|