| Survey ten persons about the type of music they like best. Give them four choices. You may want to have an “other” category in case they do not like any of your choices. Make sure you organize your data. |
|
|
| |
| 1) Make a tally chart to keep track of the responses. What are the results of the final tally for each of the four categories? |
|
4000 character(s) left
Your answer is too long. |
|
| |
|
| 2) Once you tally all of the responses, write fractions to find what fractional part of the whole each category equals. What fraction did you get for each category? |
|
4000 character(s) left
Your answer is too long. |
|
| |
|
| 3) Then multiply each of the fractions times 360 degrees. What degrees did you get for each category? |
|
4000 character(s) left
Your answer is too long. |
|
| |
|
| 4) Once you figure the size in degrees for each piece of the circle, make a circle graph. Describe the circle graph. Which category expands over the largest portion of the graph? Which category takes up the least portion of the graph? |
|
20000 character(s) left
Your answer is too long. |
|
|
Attachments |
|
| 5) Add a title and labels and some extras to make the graph appealing for all to see. Share your graph with the persons you surveyed. Describe your circle graph. |
|
20000 character(s) left
Your answer is too long. |
|
|
Attachments |
|
| 6) Did you get any unexpected results? If you were doing this survey again, how could you improve it? |
|
4000 character(s) left
Your answer is too long. |
|
| |
|
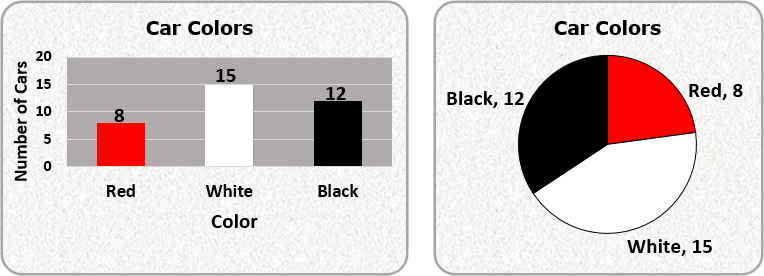
| 7) Ronald observed some cars that passed by his house one afternoon. He decided to keep a tally of the number of red, white, and black cars to see which car color occurred most often. He then made two graphs about his data. Which graph do you think is most effective in displaying the data? Give at least two reasons why you think it is the most effective way to graph the data.
|
 |
4000 character(s) left
Your answer is too long. |
|
| |
|
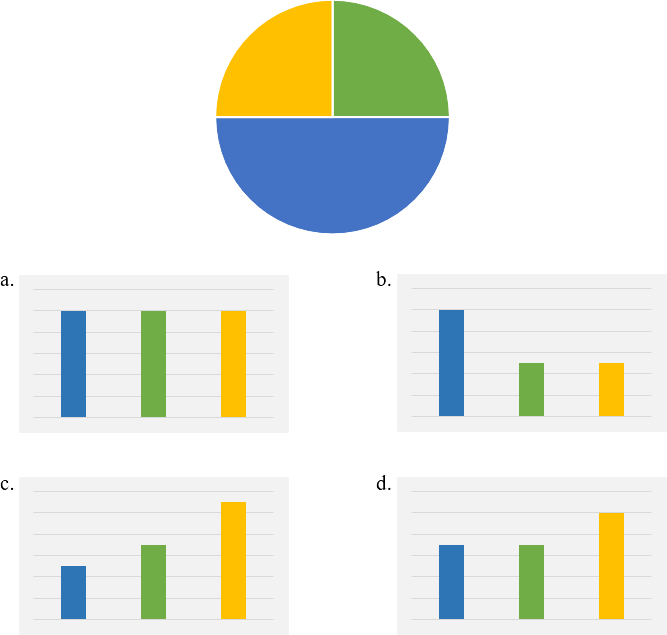
| 8) Which of the following bar graph groups represents the data from the circle graph? State the letter of your choice and explain how you decided your choice.
|
 |
20000 character(s) left
Your answer is too long. |
|
|
Attachments |
|
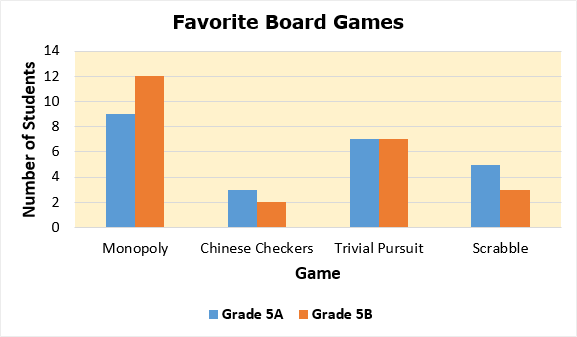
Sandra took a survey of the two fifth grades to see which board game they liked best. This graph displays the results. Use the graph to answer questions #9 through #15.
|
 |
|
| |
| |
|
| |
|
| |
|
| |
|
| |
|
| |
|
| |
|
| |
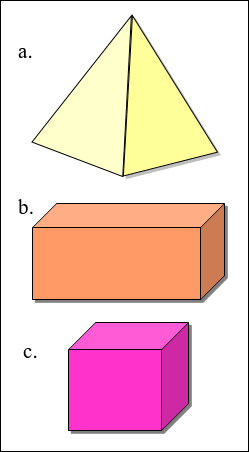
| 16) Name the given shapes. Choose from cube, rectangular prism, and pyramid. State the letter and then the name of the shape.
|
 |
4000 character(s) left
Your answer is too long. |
|
| |
|
| |
|
| |
|
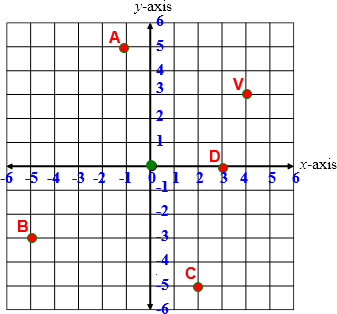
| 19) What is the ordered pair for each of the points graphed below? For example, the ordered pair for V is (4,3). State the other points along with their ordered pair.
|
 |
4000 character(s) left
Your answer is too long. |
|
| |
|
| 20) What type of graph would best show that the overall popularity of a certain flavor of soda pop is on the decline? |
|
|
|
| |
|
| 21) You have been asked to wrap the box below for a birthday present. What are the BEST dimensions for a single sheet of wrapping paper, allowing for overlap? Choose from the following: (a.) 5 by 16 (b.) 6 by 14 (c.) 9 by 18 or (d.) 12 by 22 (Hint: Find some old newspapers, old Christmas wrapping paper, plastic bags, or paper bags and actually try to wrap a box that is close in shape to a cube. Observe how wide the paper must be and how long it must be to just cover the cube. Then, apply what you observed to solve this problem. ) Explain how you solved the problem. |
 |
4000 character(s) left
Your answer is too long. |
|
| |
|
| 22) At Lincoln Elementary School, the average height of the second grade class was 37 inches. Over the summer, EVERYBODY grew exactly three inches. What was the average height of the group when they came back to school in the fall? |
|
|
|
| |
|
| 23) What is the difference between the median and mean of a set of data? |
|
4000 character(s) left
Your answer is too long. |
|
| |
|
| 24) The hands of a clock form a 90 degree or right angle at three o’clock. At which of the following times do the hands of the clock form angles greater than 90 degrees (obtuse angles).
|
 |
|
|
| |
|
| |
|
| 26) If you were directed by your school to complete Offline Activities for this course, please enter the information on the Log Entry form. |
|
| No offline activities found |
| 0 Hour(s) & 0 Minute(s) |
|
|
Attachments |
|