The fifth grade class is selling ice cream cones at lunch time to raise money for a new school computer. The number of ice cream cones they sold per week is shown below. Use the data to answers questions #1 through #5.
|
 |
|
| |
| |
|
| |
|
| |
|
| |
|
| |
|
| Keep track of the daily temperature for a five-day week. Then graph the results as a line graph. Use the data and the graph to answer questions #6 through #14. |
|
|
| |
| 6) Describe the graph. |
|
20000 character(s) left
Your answer is too long. |
|
|
Attachments |
|
| 7) What were the daily temperatures? |
|
4000 character(s) left
Your answer is too long. |
|
| |
|
| 8) What did you decide to count by up the vertical axis? Why did you decide on those divisions? Check to see that the data points on both the vertical and horizontal axis are spaced evenly. |
|
4000 character(s) left
Your answer is too long. |
|
| |
|
| 9) What is the title for your graph? What are the subtitles for the horizontal and vertical axis? |
|
4000 character(s) left
Your answer is too long. |
|
| |
|
| 10) Describe the appearance and fluctuation of the line (eg. Overall increase, overall decrease, overall fluctuating up and down). |
|
4000 character(s) left
Your answer is too long. |
|
| |
|
| 11) What was the mean temperature for the week? Explain how you found it. |
|
4000 character(s) left
Your answer is too long. |
|
| |
|
| 12) What was the median temperature for the week? Explain how you found it. |
|
4000 character(s) left
Your answer is too long. |
|
| |
|
| 13) Was there a mode for the temperature for the week? If so, what is it? Explain how you found it. |
|
4000 character(s) left
Your answer is too long. |
|
| |
|
| 14) What was the range of the temperature for the week? Explain how you found it. |
|
4000 character(s) left
Your answer is too long. |
|
| |
|
| |
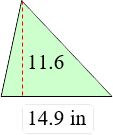
| 15) Find the area. Label the answer correctly. Name the shape.
|
 |
4000 character(s) left
Your answer is too long. |
|
| |
|
| 16) Find the area. Label the answer correctly. Name the shape.
|
 |
4000 character(s) left
Your answer is too long. |
|
| |
|
| 17) Find the area. Label the answer correctly. Name the shape.
|
 |
4000 character(s) left
Your answer is too long. |
|
| |
|
| |
|
| |
|
| 20) Choose the correct order for placing the numbers 1, 2/3, 0.75 in the correct boxes to make the statement true.
|
 |
|
|
| |
|
| |
|
| |
|
| |
|
| |
|
| 25) What type of graph would you make for data that shows the number of cookies sold by each Girl Scout troop in Belmont County? Explain why you chose that type of graph. |
|
4000 character(s) left
Your answer is too long. |
|
| |
|
| 26) If you were directed by your school to complete Offline Activities for this course, please enter the information on the Log Entry form. |
|
| No offline activities found |
| 0 Hour(s) & 0 Minute(s) |
|
|
Attachments |
|