For problems #1 through #4, select the best type of graph for graphing the data described. Choose from:
Line Bar Circle Line Plot
|
|
|
| |
| |
|
| |
|
| |
|
| |
|
| Now it’s your turn to collect some data. What do you think is the most popular color of cars? Predict what you think are the three most popular colors of cars and then test your theory to see if you are right. |
|
|
| |
| 5) What do you think the most popular color of cars is? |
|
4000 character(s) left
Your answer is too long. |
|
| |
|
| Plan a table and collect data to support your prediction. Display the data in a chart. Make a graph that is appropriate for the data you collected. Answer the following questions about your data. |
.gif) |
|
| |
| 6) Where did you collect the data? |
|
4000 character(s) left
Your answer is too long. |
|
| |
|
| 7) What time of day did you collect your data? |
|
4000 character(s) left
Your answer is too long. |
|
| |
|
| 8) What was the tally of each color you observed? |
|
4000 character(s) left
Your answer is too long. |
|
| |
|
| 9) Describe your graph. |
|
20000 character(s) left
Your answer is too long. |
|
|
Attachments |
|
| 10) Based on your results, what do you think are the three most popular colors of cars? |
|
4000 character(s) left
Your answer is too long. |
|
| |
|
Conduct another data collecting session. Collect your data in a different location and different time of day. Answer the questions below.
|
 |
|
| |
| 11) Where did you collect your data the second time? |
|
4000 character(s) left
Your answer is too long. |
|
| |
|
| 12) What time of day did you collect your data the second time? |
|
4000 character(s) left
Your answer is too long. |
|
| |
|
| 13) What was the tally of each color you observed? |
|
4000 character(s) left
Your answer is too long. |
|
| |
|
| 14) Describe your graph. |
|
20000 character(s) left
Your answer is too long. |
|
|
Attachments |
|
| 15) Based on your results, what do you think are the three most popular colors of cars? |
|
4000 character(s) left
Your answer is too long. |
|
| |
|
| 16) Research your results on the Internet. See if you can find some research data that verifies your conclusions. What results did you find on the Internet? State the URL of the website where you found your information. |
|
20000 character(s) left
Your answer is too long. |
|
|
Attachments |
|
| 17) What would be some reasons why the data you collected may not be the same as data collected nationally? |
|
20000 character(s) left
Your answer is too long. |
|
|
Attachments |
|
| |
| |
|
| |
|
| 20) True or False. A diameter is a chord that crosses the center of the circle. |
|
|
|
| |
|
| |
|
| |
|
| |
|
| 24) A measurement of a rectangular box is given as 48 cubic inches. The measure could represent the: |
|
|
|
| |
|
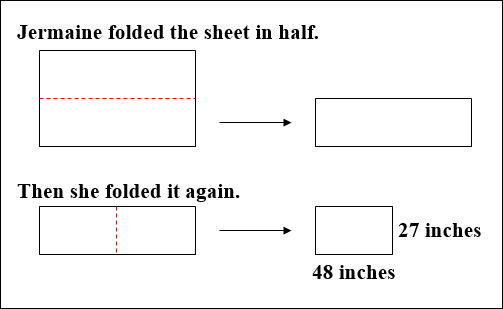
| 25) Take a sheet of notebook paper and make a model of Jermaine’s experiment. Make sure to label the length of the sides of the paper to help you solve the problem. How big was the sheet when it was opened?
|
 |
|
|
| |
|
| 26) If you were directed by your school to complete Offline Activities for this course, please enter the information on the Log Entry form. |
|
| No offline activities found |
0 Hour(s) & 0 Minute(s)
|
|
|
Attachments |
|