|
Some of the questions in this unit may be answered by recording an audio file. If you chose to record the answer, click on the "Add Recording" button and follow the on-screen instructions closely. Once you have completed and attached the recording, enter the word “COMPLETE” in the text box. (Note: If your computer does not have a built-in microphone, a microphone or microphone/headset combination is needed to record audio.)
Graphing Linear Equations
|
|
|
| |
| 1)
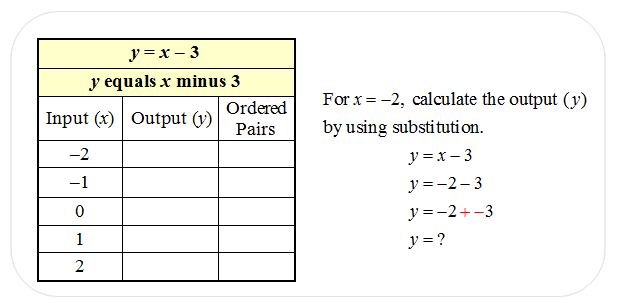
Print out or copy the given table. For the function y = x – 3, find the y-values for the x-values provided in the chart. On graph paper, graph the ordered pairs. (a) State the five ordered pairs and (b) describe the type of graph that is formed when the points are connected. |
 |
4000 character(s) left
Your answer is too long. |
|
| |
|
| 2)
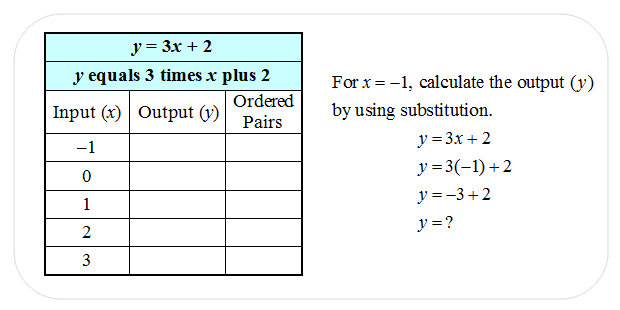
Print out the table. For the function y = 3x + 2, find the y-values for the x-values provided in the chart. On graph paper, graph the ordered pairs. (a) State the five ordered pairs and (b) describe the type of graph that is formed when the points are connected. |
 |
4000 character(s) left
Your answer is too long. |
|
| |
|
| |
| 3)
List three ordered pairs for the dark points (red) that fall on the graphed line. |
|
4000 character(s) left
Your answer is too long. |
|
| |
|
| 4)
Which equation could be used to represent the relationship of “x” and “y” for the ordered pairs found in the previous problem? (Hint: Substitute the x-value of a few of the points into the equation and solve for the corresponding y-values.) |
|
|
|
| |
|
| 5)
Consider other points that fall on the line and fall away from the line and which ones fit the equation above? The diamond (yellow) point and the triangle (blue) point are provided to use as a test points. Is the following conjecture true or false? Please give a rationale to support the answer. In the rationale, include how the diamond and triangle points do or do not fit the equation. |
 |
4000 character(s) left
Your answer is too long. |
|
|
Attachments |
|
|
Graphing a Line Using the x- and y-intercepts |
|
|
| |
| 6)
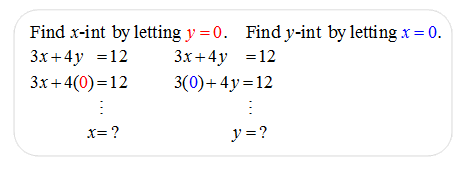
What are the x- and y-intercepts of the equation, 3x + 4y = 12. (Note: The intercepts are written as ordered pairs.) |
 |
|
|
|
|
|
|
| |
|
| |
|
| 8)
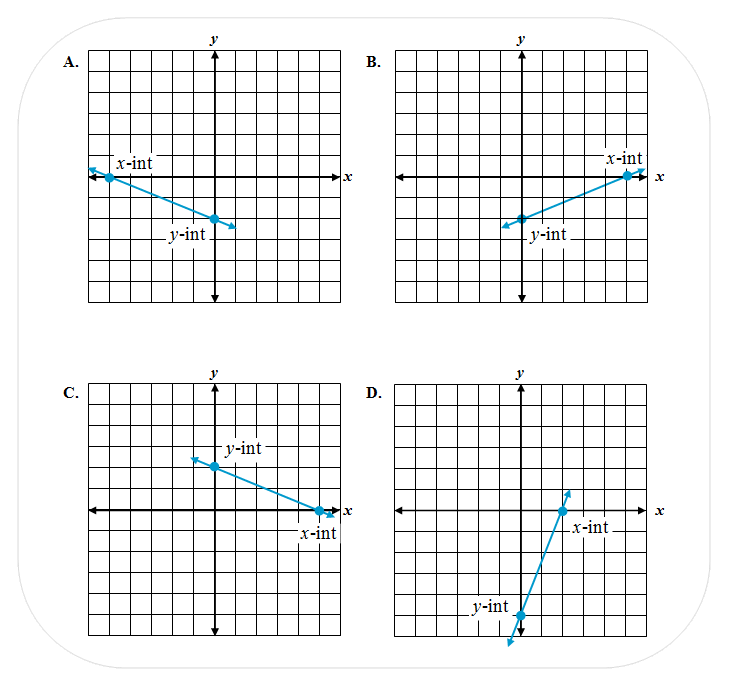
On graph paper, graph the equation of 5x – 2y = 10 using the x- and y-intercepts. State the (a) letter of the correct graph and (b) the coordinates of the x- and y-intercepts. |
 |
4000 character(s) left
Your answer is too long. |
|
| |
|
| 9)
Which of the follow statements is a true general statement about the x- and y-intercepts? |
|
|
|
| |
|
| |
| |
|
| |
|
| |
|
| |
|
|
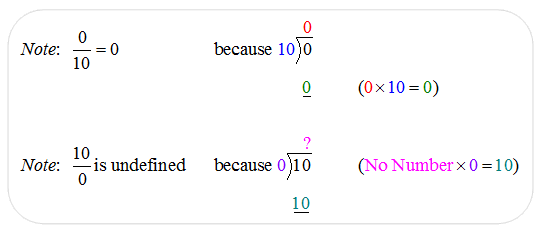
The slopes of the linear graphs shown in the next two problems are SPECIAL cases. In one case, the slope of the line equals zero, and in the other case the slope of the line is undefined. Consider the statements below, and then calculate the slopes of each line. |
 |
|
| |
| 14)
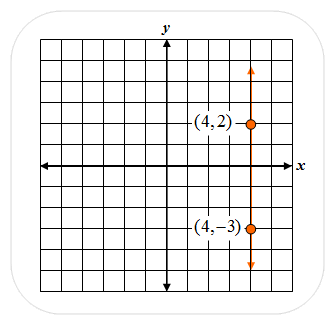
What is the slope of the linear graph? |
 |
|
|
| |
|
| 15)
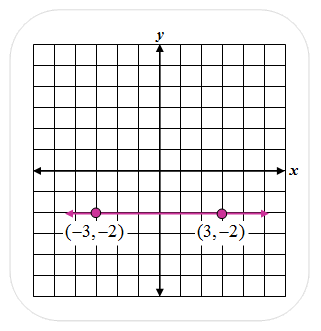
What is the slope of the linear graph? |
 |
|
|
| |
|
|
Graphing a Line on the Coordinate Plane Using a Point and the Slope |
|
|
| |
| 16)
On graph paper, graph the line containing the point (–3, –4) and has a slope of m = 1/2. To demonstrate that the graph is correct, locate the x-intercept. What are the coordinates of the x-intercept? |
|
|
|
| |
|
| 17)
On graph paper, graph the line containing the point (–5, 1) and has a slope of m = –2/3. To demonstrate that the graph is correct, locate the x-intercept. What are the coordinates of the x-intercept? |
|
|
|
| |
|
|
Compare How Changes in an Equation Affect the Related Graph |
|
|
| |
| 18)
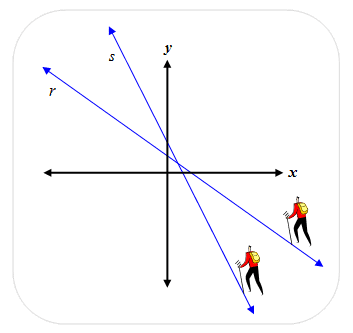
Compare the slopes of the two lines. If a person were able to climb the two lines from the bottom right to the upper left, which line would be steeper to climb? |
 |
|
|
| |
|
|
For the next four problems, look for relationships between the given equations and the corresponding graphs. The linear graphs were created with a graph calculator. All of the equations are written in slope intercept form, y = mx + b, where m represents the slope and b represents the y-intercept. |
|
|
| |
| 19)
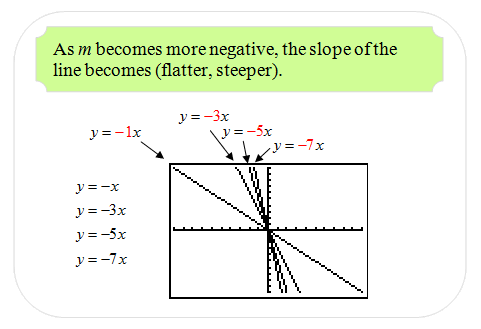
Study the graphs of the given equations and the given statement. Pay close attention to the incline or decline of the graphed lines and how this corresponds with the numerical value of the slope (m) in the equation. Which term in parenthesis completes the statement correctly? (Note: In these equations, the y-intercept is zero.) |
 |
|
|
| |
|
| 20)
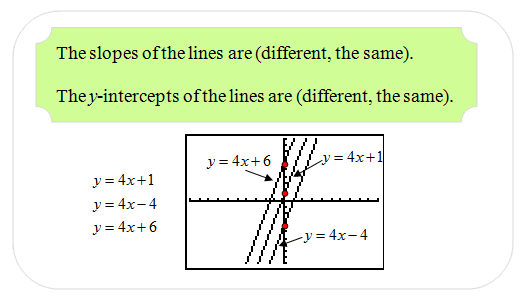
Study the graphs of the given equations and the given statements. Pay close attention to what varies and what stays the same. Which terms in parenthesis complete the statements correctly in the order given? |
 |
|
|
| |
|
| 21)
Refer to the previous problem to complete the following statement. When the slopes of linear equations are the same, the lines of the linear graphs: |
|
|
|
| |
|
| 22)
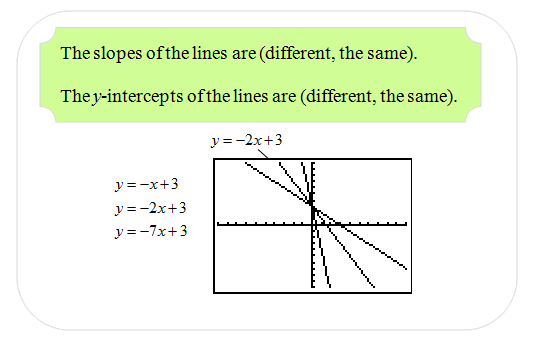
Study the graphs of the given equations and the given statements. Pay close attention to what varies and what stays the same. Which terms in parenthesis complete the statements correctly in the order given? |
 |
|
|
| |
|
| |
| |
|
| |
|
|
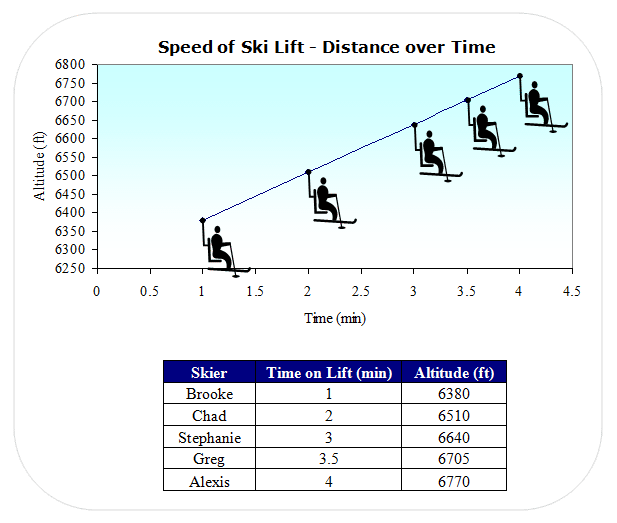
The chart and graph below shows the altitude that a lift on a ski rope rises at a constant speed. Use the chart and graph to answer the next two questions. Passengers board the lift at 6250 feet. |
 |
|
| |
| |
|
| 26)
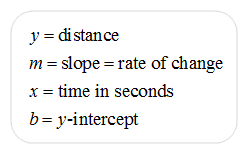
What is an equation in slope-intercept form that represents the relationship of the data provided in the chart and graph? (Slope-Intercept Form: y = mx + b) |
 |
|
|
| |
|
|
Constant Rates of Change and Predicting Solutions |
|
|
| |
|
Lori waits tables part time for customers at her aunt's restaurant. She earns an average of $5 in tips for each table. She makes a chart to show her working hours (3 to 6 hours) and the amount of tips she makes for waiting on 8 to 11 tables over the three hours. Use the chart to analyze the data and make predictions about Lori's part-time job. |
 |
|
| |
| |
|
| |
|
| 29)
A paramotor is a parachute propelled by a fan-like motor. After reaching a height of 2000 feet, a paramotorist descends an average rate of 250 feet per minute. After 1 minute, the paramotorist has an altitude of 1750 feet. After 2 minutes, the paramotorist has an altitude of 1500 feet. After 3 minutes, the paramotorist has an altitude of 1250 feet. Predict how many minutes it will take the paramotorist to reach the ground? |
 |
|
|
| |
|
| |
| 30)
Describe a “real-life” example of direct variation; that is, one quantity varies directly as the other quantity changes. |
|
4000 character(s) left
Your answer is too long. |
|
|
Attachments |
|
| 31)
If y varies directly as x, and y = 27 when x = 9, find the constant of the variation and write an equation of direct variation. |
 |
|
|
| |
|
| 32)
If y varies directly as x, and y = 48 when x = 6, find the constant of the variation and write an equation of direct variation. |
|
|
|
| |
|
| |
|
| 34) If you were directed by your school to complete Offline Activities for this course, please enter the information on the Log Entry form. |
|
| No offline activities found |
0 Hour(s) & 0 Minute(s)
|
|
|
Attachments |
|