|
Some of the questions in this unit may be answered by recording an audio file. If you chose to record the answer, click on the "Add Recording" button and follow the on-screen instructions closely. Once you have completed and attached the recording, enter the word “COMPLETE” in the text box. (Note: If your computer does not have a built-in microphone, a microphone or microphone/headset combination is needed to record audio.) |
|
|
| |
| |
| 1) What stems would be used to plot the following data: 3, 8, 15, 19, 22, 39, 20, 30, 27, 24, 13, 9, 43, 15, 20? |
|
|
|
|
|
|
|
| |
|
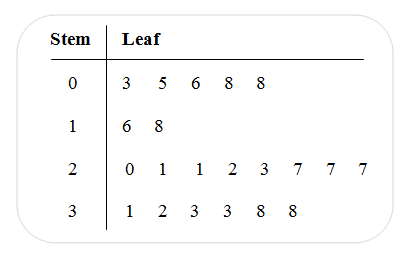
| Refer to the Stem-and-Leaf Plot below to answer the next two questions. |
 |
|
| |
| 2) True or False. The data value, 27, can be represented by “7 | 2”. |
|
|
|
| |
|
| 3) Which statement about the stem-and-leaf plot is true?
|
|
|
|
| |
|
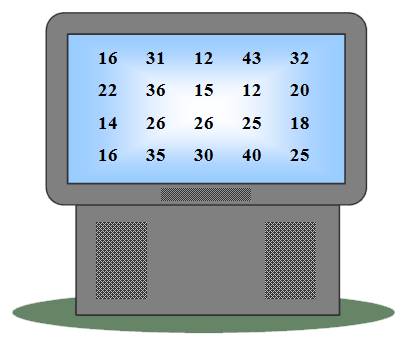
| Students in the ninth grade class completed a survey in which they were asked how many hours they spent watching TV in the month of September. Their responses are shown below. Use the data to answer the next three questions. |
 |
|
| |
| |
|
| |
|
| 6) How many students watched exactly 33 hours of TV? |
|
|
|
| |
|
| |
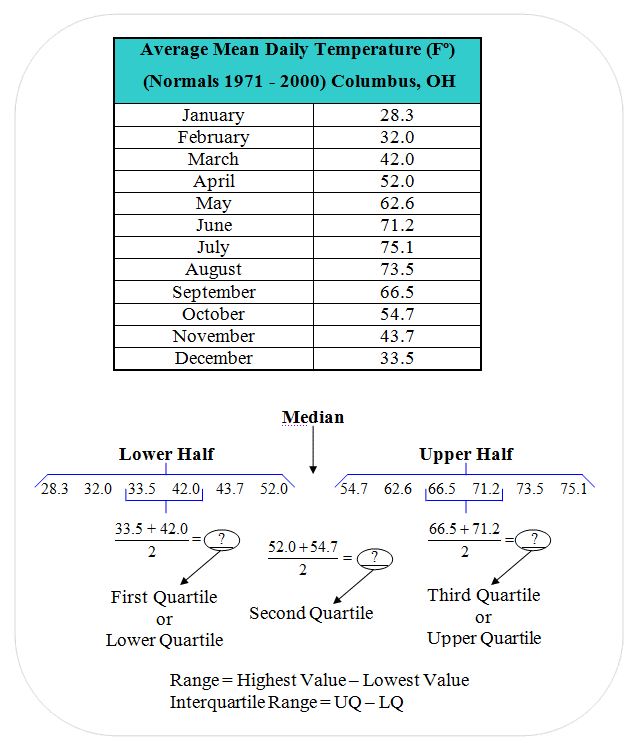
| The average mean daily temperatures for Columbus, OH, over a thirty-year span are listed below. Calculate the median, lower quartile, upper quartile, interquartile range, and range, and then answer the next four questions. |
 |
|
| |
| |
|
| 8) What are the lower and upper quartiles? |
|
|
|
| |
|
| |
|
| 10) What is the interquartile range? |
|
|
|
| |
|
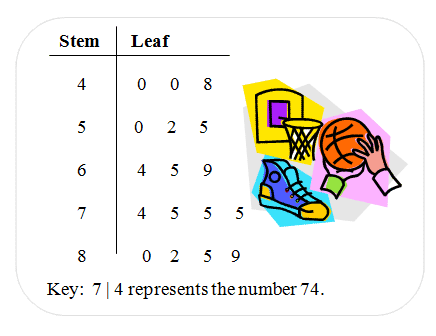
| The stem-and-leaf plot shown below represents prices of basketball shoes at The Runner's Warehouse. Use the stem-and-leaf plot to answer the next four questions. |
 |
|
| |
| |
|
| 12) What are the lower and upper quartiles? |
|
|
|
| |
|
| |
|
| 14) What is the interquartile range? |
|
|
|
| |
|
| |
| The box-and-whiskers plot below shows the height in inches of fifteen girls on the Blue Devil High volleyball team. Use the plot to answer the next four questions. |
 |
|
| |
| |
|
| 16) What are the lower and upper extremes? |
|
|
|
| |
|
| 17) What are the lower and upper quartiles? |
|
|
|
| |
|
| 18) What is the interquartile range? |
|
|
|
| |
|
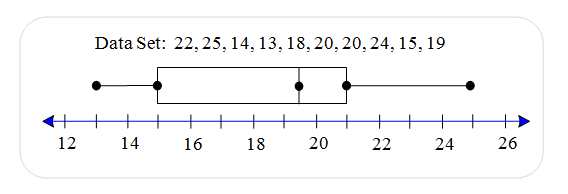
| 19) A student used the data below to draw the box-and-whiskers plot. What is wrong with the student’s graph? |
 |
4000 character(s) left
Your answer is too long. |
|
|
Attachments |
|
| |
| For the next five problems, select the type of sampling for the given situation. |
|
|
| |
| 20) Students assigned to an odd-numbered seat were surveyed. |
 |
|
|
| |
|
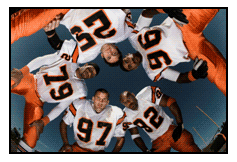
| 21) The Tigers football team members were surveyed to see if they preferred sports or contemporary music. |
 |
|
|
| |
|
| 22) A person at the local pet store solicited willing shoppers to fill out a survey about the type of pet(s) they own. |
 |
|
|
| |
|
| 23) A surveyor flipped through the phone book and selected 50 names by pointing to a name without reading the name first. |
 |
|
|
| |
|
| 24) The math teacher asked every third student if he or she would rather have a take-home test on Friday or an open-book test in class on Monday. |
 |
|
|
| |
|
| 25) Why is the question below potentially biased? Rewrite the paragraph so that the question is not biased. |
 |
4000 character(s) left
Your answer is too long. |
|
|
Attachments |
|
| |
| 26) Cool Diamonds jewelry store conducted a survey of 100 shoppers in the local mall and asked the participants if they owned a "Cool Diamonds" credit card. Twenty-four of the 100 shoppers said that they owned one. If about 4,500 people shop in the mall each day, predict how many of them probably have a Cool Diamonds credit card.
|
 |
|
|
| |
|
| 27) In a survey of 300 residents of Johnstown, 43 use whitening strips suggested by their dentists. If there are 10,800 people that live in Johnstown, how many of them probably use whitening strips?
|
 |
|
|
| |
|
| 28) Television networks rely on surveys to determine how many people watch their programs. In a survey of 3,000 randomly selected households, 480 of the households watched the same game show that was airing on Saturday night only. If there are 105 million households in the United States, about how many households watched the same game shown? |
 |
|
|
| |
|
|
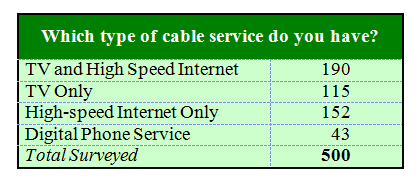
The nation’s leading cable company has 39.5 million customers (39,500,000). Below are the results of a survey sample of 500 customers conducted to determine which type of cable service the customers have purchased. Use the results to answer the next five questions. |
 |
|
| |
| |
|
| 30) True or False. The proportion to solve the previous problem is as follows: 152 / 500 = x / 39,500,000. |
|
|
|
| |
|
| 31)
Predict what PERCENT of the cable customers have only high-speed Internet? |
|
|
|
| |
|
| 32)
True or False. To determine about how many of the 39.5 million cable customers have only high-speed Internet, the decimal for the percent answer in the previous problem can be multiplied by 39.5 million. |
|
|
|
| |
|
| |
|
| 34) If you were directed by your school to complete Offline Activities for this course, please enter the information on the Log Entry form. |
|
| No offline activities found |
0 Hour(s) & 0 Minute(s)
|
|
|
Attachments |
|