| |
| For all the graphs shown in this unit, each notch on the x- and y-axes represents one unit, unless otherwise specified. |
|
|
| |
| 1) A Locus is the set of all points that satisfy a given condition or set of conditions. |
|
|
|
| |
|
| 2) Loci (plural of locus) are collections of points. |
|
|
|
| |
|
| 3) As a windmill blade turns, the locus of points created by the path that point P covers in one complete rotation is what shape? |
 |
|
|
| |
|
| 4) If point P followed the path created by a rainbow, what shape is the locus of points? |
 |
|
|
| |
|
|
For the next three problems, identify the geometric figure formed by the description of the locus of points. Assume that the points are located in a plane. |
|
|
| |
| 5)
“a set of points that are located seven centimeters from a given center point” |
|
4000 character(s) left
Your answer is too long. |
|
| |
|
| 6)
“a set of points that are located three centimeters from a straight line” (Hint: There are two paths in this figure.) |
|
4000 character(s) left
Your answer is too long. |
|
| |
|
| 7)
“a set of points where any given point is equidistant from the rays of an angle” |
|
4000 character(s) left
Your answer is too long. |
|
| |
|
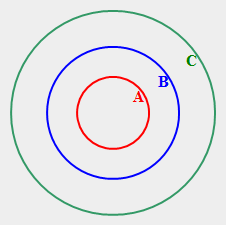
| 8) For the three concentric circles shown below, the length of the radius of circle B is twice the length of the radius of circle A. The length of the radius of circle C is three times the length of the radius of circle A. Which of the concentric circles is a locus of points equidistant from the other two circles? |
 |
|
|
| |
|
| |
|
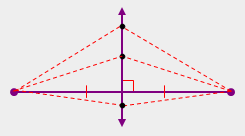
| 10) The perpendicular bisector of a line segment is a locus of points that are equidistant from the endpoints of the segment. |
 |
|
|
| |
|
| Locus and Systems of Equations |
|
|
| |
| As you work through the remaining problems, you may need to print out several copies of graph paper. You will find a link to graph paper in the lesson area. |
|
|
| |
| 11) There are three types of solutions for a system of equations in two variables. Which type of solution described below is NOT possible in a system of equations? State the letter of the correct answer. |
|
|
|
| |
|
| |
|
| In the next four problems, a series of questions will be asked about determining the locus of points that satisfy the system of equations shown below. |
 |
|
| |
| |
|
| 14) What is the slope and y-intercept of the first equation? What is the slope and y-intercept of the second equation? |
|
4000 character(s) left
Your answer is too long. |
|
| |
|
| Graph both lines on graph paper using the slope-intercept method, and then answer the next question. |
|
|
| |
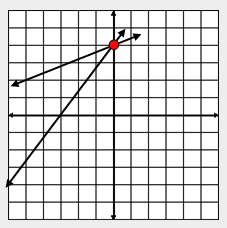
| 15) True or False. The graph below represents the locus of points that satisfy both equations. |
 |
|
|
| |
|
| |
|
| For the next three problems, use the “substitution method” to determine the locus of points that satisfy both equations. State the answers as ordered pairs. |
|
|
| |
| |
|
| |
|
| |
|
| For the next three problems, use the “elimination method” to determine the locus of points that satisfy both equations. State the answers as ordered pairs. |
|
|
| |
| |
|
| |
|
| |
|
| For the next three problems, refer to the following scenario: The computer club sponsored a spaghetti dinner. Tickets were sold for adult meals and children’s meals. The prices for the dinner were $5.00 for adults and $3.00 for the children. A total of 1075 tickets were sold. The total income for the ticket sales was $4725. How many adult tickets and how many student tickets were sold? |
|
|
| |
| 23) If “A” represents the number of adults and “S” represents the number of students who purchased a spaghetti dinner, which equation represents the NUMBER of tickets sold? |
|
|
|
| |
|
| 24) A second equation can be written from the information given in the scenario that represents the value of the ticket sales. Which equation represents the VALUE of the total ticket sales? |
|
|
|
| |
|
| |
|
| Loci and Systems of Inequalities |
|
|
| |
| |
|
| |
|
| For the next three problems, first graph the inequality shown below, and then answers the questions. |
 |
|
| |
| |
|
| |
|
| For the next three problems, graph the system of inequalities shown below on paper to determine the locus of points that satisfy both inequalities, and then answer the questions. |
 |
|
| |
| 30) Answer the following questions about the graph of Inequality 1: (a) What is the y-intercept of the boundary line? (b) What is the slope of the boundary line? (c) What type of line is used as the boundary line (dotted or solid)? (d) Which side of the boundary line is shaded (upper or lower)? |
|
4000 character(s) left
Your answer is too long. |
|
| |
|
| 31) Answer the following questions about the graph of Inequality 2: (a) What is the y-intercept of the boundary line? (b) What is the slope of the boundary line? (c) What type of line is used as the boundary line (dotted or solid)? (d) Which side of the boundary line is shaded (upper or lower)? |
|
4000 character(s) left
Your answer is too long. |
|
| |
|
| |
|
| Review of Quadratic Functions |
|
|
| |
| 33) The graph of a quadratic function is a curve known as a __________. |
|
|
|
| |
|
| 34) Fill in the blanks: The graph of a quadratic function with a minimum vertex opens _____. The graph of a quadratic function with a maximum vertex opens _____. |
|
|
|
| |
|
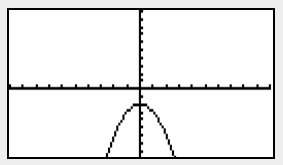
| 35) In the graph shown below, answer the following questions: (a) Is the vertex of the graph a maximum or minimum point? (b) What is equation of the line that is the axis of symmetry? |
 |
4000 character(s) left
Your answer is too long. |
|
| |
|
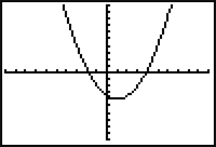
| 36) Which best describes the vertex of the given parabola? |
 |
|
|
| |
|
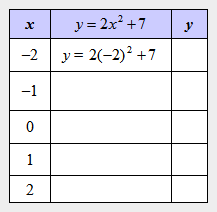
| 37) Complete the table of y-values for the given function and x-values. List the ordered pairs. |
 |
4000 character(s) left
Your answer is too long. |
|
| |
|
| |
|
| |
|
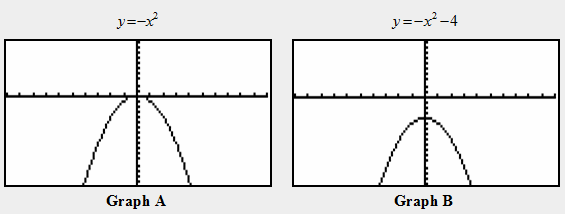
| 40) Compare the two functions shown below and their corresponding graphs. The parabola in Graph B is the same shape as the parabola in Graph A; but, it is translated. Describe the translation of the vertex of the parabolas from Graph A to Graph B. |
 |
4000 character(s) left
Your answer is too long. |
|
|
Attachments |
|
| |
|
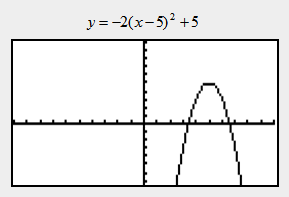
| 42) True or False. The graph shown below is the locus of points that represents the given quadratic equation. |
 |
|
|
| |
|
| Loci of Nonlinear Equations and Nonlinear Systems of Equations |
|
|
| |
| For the next three problems, graph the equations shown below on graph paper, and then answer the questions. |
 |
|
| |
| 43) Answer the following questions about the quadratic equation: (a) What are the coordinates of the vertex of the parabola? (b) What is the parabola’s direction of opening (upward or downward)? |
|
4000 character(s) left
Your answer is too long. |
|
| |
|
| |
|
| |
|
| |
|
| |
|
| 48) If you were directed by your school to complete Offline Activities for this course, please enter the information on the Log Entry form. |
|
| No offline activities found |
0 Hour(s) & 0 Minute(s)
|
|
|
Attachments |
|