| |
| 1) True or False. In a two-dimensional coordinate plane, the graphs of linear equations will be straight lines. |
|
|
|
| |
|
| 2) Which statement is true for the standard form of a linear equation? |
|
|
|
| |
|
| |
|
| |
|
| |
|
| |
|
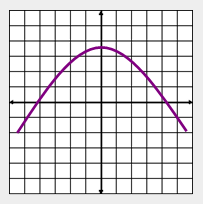
| 7) True or False. The graph shown below represents a linear equation. |
 |
|
|
| |
|
| |
| 8) The slope of a line refers to what characteristics of a line? |
|
4000 character(s) left
Your answer is too long. |
|
| |
|
| |
|
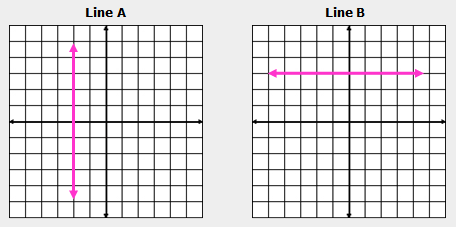
| 10) Which statement is true about the slopes of the lines graphed below? |
 |
|
|
| |
|
| |
|
| |
|
| 13) Select the phrase that completes the following statement about Theorem 32: If an equation of a line is written in slope-intercept form (y = mx + b), then ... |
|
|
|
| |
|
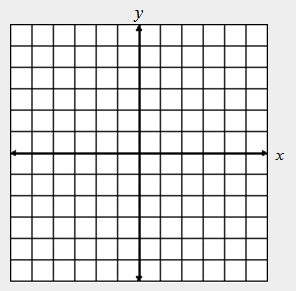
| 14) Write the equation, –4x + y = –8, in slope-intercept form, and then graph the equation. State (a) the slope-intercept form, (b) the location of the y-intercept, and (c) the slope. (To print out the graph paper provided below, right-click and print picture.) |
 |
4000 character(s) left
Your answer is too long. |
|
| |
|
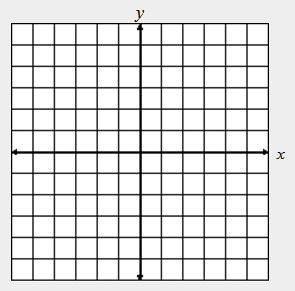
| 15) Graph the equation, x + 2y = 6 by finding the x-intercept and the y-intercept. State (a) the location of the x-intercept, (b) the location of the y-intercept, and (c) the slope. (To print out the graph paper provided below, right-click and print picture.) |
 |
4000 character(s) left
Your answer is too long. |
|
| |
|
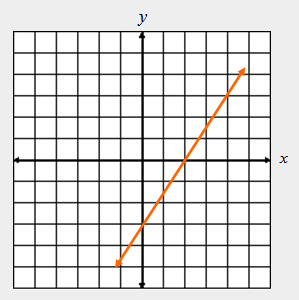
| 16) For the given graph, state (a) the type of slope the line has, (b) the location of the x-intercept, (c) the location of the y-intercept, and (d) the slope. (Each line on the graph represents one unit.) |
 |
4000 character(s) left
Your answer is too long. |
|
| |
|
| 17) On graph paper, graph the equation, 4x + 3y = 15. State the (a) slope, (b) x-intercept, and (c) y-intercept? |
|
4000 character(s) left
Your answer is too long. |
|
| |
|
| |
| |
|
| |
|
| |
|
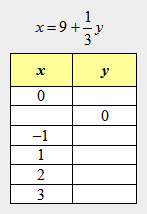
| 21) Refer to the equation given below and fill in the missing coordinates. (a) What are the six ordered pairs displayed in the table that could be used to graph the equation? (b) What is the slope of the line that represents the equation? (Hint: The equation may be easier to solve by first multiplying both sides by 3 to write an equivalent equation without a fraction.) |
 |
4000 character(s) left
Your answer is too long. |
|
| |
|
| 22) The following points are collinear: A(2,19), B(1, 11) and C(–1,–5). Use points A and B to determine the slope and the equation of the line that includes all three points. (a) State the linear equation for the line in slope-intercept form. (b) Explain how to prove that point C is also a point on the line. |
|
4000 character(s) left
Your answer is too long. |
|
| |
|
| Equations of Horizontal and Vertical Lines |
|
|
| |
| |
|
| |
|
| |
|
| |
|
| |
|
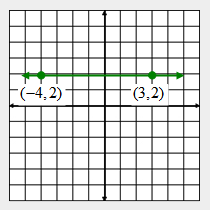
| 28) The equation, y = 2, and the coordinates for two points on the line are shown below. (a) What is the slope of the line? (b) Explain how to calculate the slope by using the two points given. |
 |
4000 character(s) left
Your answer is too long. |
|
| |
|
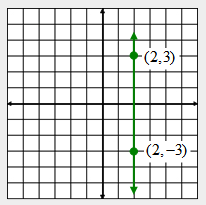
| 29) The equation, x = 2, and the coordinates for two points on the line are shown below. (a) What is the slope of the line? (b) Explain how to calculate the slope by using the two points given. |
 |
4000 character(s) left
Your answer is too long. |
|
| |
|
| |
|
| Parallel and Perpendicular Lines |
|
|
| |
| |
|
| 32) The graphs of the lines of the equations given below are __________ lines. |
 |
|
|
| |
|
| 33) For the equations shown below, the product of the slopes is ____ and the graphs of the lines are __________. |
 |
|
|
| |
|
| 34) Which equation represents a line that is parallel to y = 3x + 5 and passes through the point (–2, 8)? |
|
|
|
| |
|
| |
|
| |
|
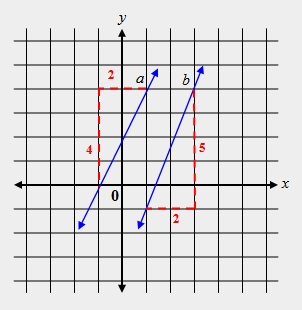
| 37) Are lines "a" and "b" parallel? Explain, through slopes, how you derived the answer. |
 |
4000 character(s) left
Your answer is too long. |
|
|
Attachments |
|
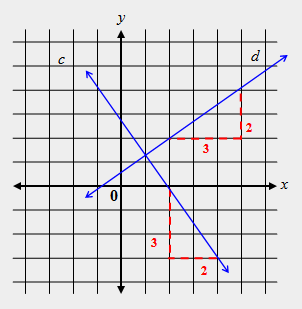
| 38) Are lines "c" and "d" perpendicular? Explain, through slopes, how you derived the answer. |
 |
4000 character(s) left
Your answer is too long. |
|
|
Attachments |
|
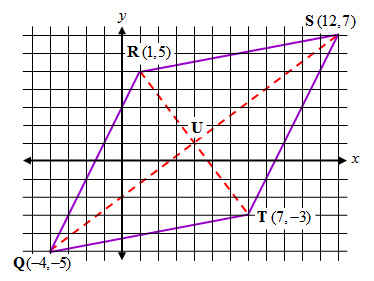
| Determine, through slopes, what kind of quadrilateral is graphed below, and then answer the next three questions. |
 |
|
| |
| 39) What are the slopes of (a) segment QR, (b) segment TS, (c) segment RS, and (d) segment QT? |
|
4000 character(s) left
Your answer is too long. |
|
| |
|
| 40) Answer the following questions: (a) What is the slope of diagonal QS? (b) What is the slope of diagonal RT? (c) Segment QR and segment RT form what kind of lines? |
|
4000 character(s) left
Your answer is too long. |
|
| |
|
| 41) What kind of quadrilateral is QRST? |
|
|
|
| |
|
| Use, Create, and Interpret Scatter Plots |
|
|
| |
| 42) Answer the following questions about the scatter plots shown below: (a) Which scatter plot shows a positive correlation in the data? (b) Which scatter plot shows a negative correlation in the data? (c) Which scatter plot shows no correlation in the data? |
 |
4000 character(s) left
Your answer is too long. |
|
| |
|
| 43) True or False. In a scatter plot, the "line of best fit" must pass through all the points. |
|
|
|
| |
|
| The following table shows the national average of the math SAT scores for students entering college classes from 1993 through 2002. Print out the table and grid, and then make a scatter plot. Upon completion of the scatter plot, draw a "line of best fit" and then answer the next three questions. |
 |
|
| |
| 44) Select the meaning of the slope of the "line of best fit” in the graph. |
|
|
|
| |
|
| 45) Select two points that your “line of best fit” passes through and calculate the slope of the “line of best fit”. Then write the equation of the line of best fit. (a) What is the slope of YOUR “line of best fit”? (b)What were the two points that you used to determine the slope? |
|
4000 character(s) left
Your answer is too long. |
|
| |
|
| |
|
| 47) Use the equation of the "line of best fit” to estimate the national average math SAT test score (a) for 2003 and (b) for 2004. |
|
4000 character(s) left
Your answer is too long. |
|
| |
|
| Extended Research: Check with your instructor to see if he/she is interested in awarding extra credit to you for writing a one-page report on the following research topic: Since the actual 2003 and 2004 national average math SAT scores are already compiled, do an Internet search and find out the actual results. What are the actual results of the national math SAT scores for the years 2003 and 2004? Compare your “predicted” scores with the actual scores. How does the trend of the actual data compare to the “predicted” scores? Predict what the SAT scores will be in 2060. Justify your prediction based in mathematics, in actual results, and some common sense. You may include graphs and actual data in your report. Be sure to include a list of websites that you referenced when writing the report. |
|
|
| |
| 48) If you were directed by your school to complete Offline Activities for this course, please enter the information on the Log Entry form. |
|
| No offline activities found |
0 Hour(s) & 0 Minute(s)
|
|
|
Attachments |
|