| Measures of Central Tendency |
|
|
| |
| 1) The sum of all of the data divided by the number of pieces of data (average) is the__________ of the data. |
|
|
|
| |
|
| 2) The difference between the highest and the lowest piece of data is the __________ of the data. |
|
|
|
| |
|
| 3) The number in the set of data that occurs most often is the __________ of the data. |
|
|
|
| |
|
| 4) When the data is arranged in order, the middle number is the __________ of the data. When there are two middle numbers, then the __________ of the two middle numbers must be calculated to determine the measure of central tendency. |
|
|
|
| |
|
| |
|
| |
|
| |
| 7) Quartiles divide a data set into how many parts? |
|
|
|
| |
|
| 8) The second quartile is the __________ of the data set. |
|
|
|
| |
|
| 9) The lower quartile (First Quartile) is the... |
|
|
|
| |
|
| 10) The upper quartile (Third Quartile) is the... |
|
|
|
| |
|
| 11) What is the term given to the RANGE of the middle half of the data; that is, the difference between the Upper Quartile and the Lower Quartile (UQ – LQ)? |
|
|
|
| |
|
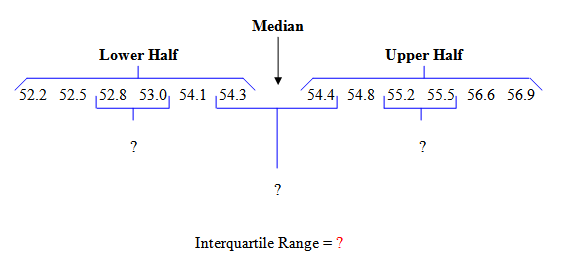
| Refer to the data in the diagram shown below to solve the next three problems. |
 |
|
| |
| |
|
| |
|
| |
|
| |
|
| |
| |
|
| 17) In a data set, the smallest data point is called the __________ __________ and the largest data point is called the __________ __________. |
|
|
|
| |
|
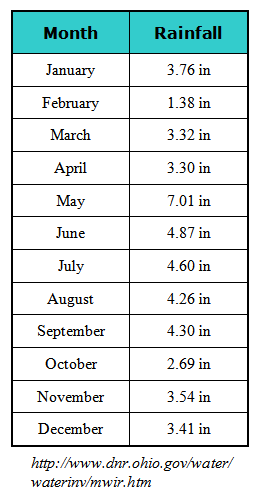
| In Ohio, the total rainfall for each month for year 2004 is listed in the table below with June's rainfall being among the highest in Ohio history since 1902. Arrange the data in order from least to highest, and then solve the next eight problems. |
 |
|
| |
| |
|
| |
|
| |
|
| |
|
| |
|
| 23) What are the limits for the outliers? |
|
|
|
| |
|
| |
|
| 25) In Data Set A the outliers have been removed and the upper quartile and lower quartile have been recalculated. The outliers are graphed separately from the rest of the data. Data Set B is provided to compare the two different graphs of the same data. Why do you think outliers are identified and graphed separately when analyzing and graphing data? |
 |
4000 character(s) left
Your answer is too long. |
|
| |
|
| |
| 26) What type of correlation does the scatter plot display? |
 |
|
|
| |
|
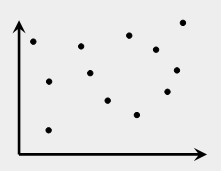
| 27) What type of correlation does the scatter plot display? |
 |
|
|
| |
|
| |
|
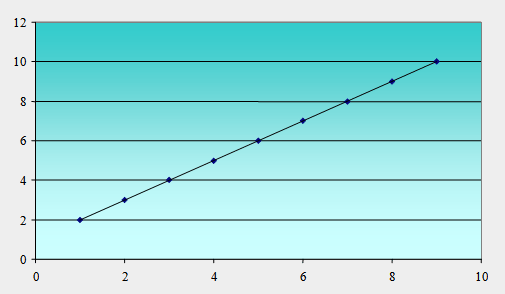
| 29) When the line of “best fit” for a scatter plot passes through EVERY point, the graph is __________? |
 |
|
|
| |
|
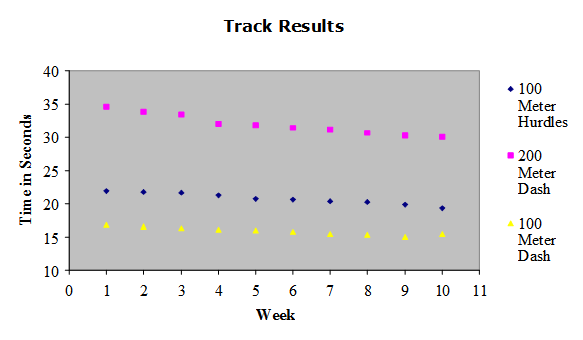
| Michelle's track schedule lasted for ten weeks. She participated in the 100 Meter Hurdles, the 100 Meter Dash, and the 200 Meter Dash. Michelle’s times for the three events in which she participated over the ten-week period is shown below in a scatter plot. Refer to the scatter plot to answer the next two questions. |
 |
|
| |
| 30) As the number of weeks increased, Michelle’s time __________. |
|
|
|
| |
|
| 31) What type of relationship does the scatter plot show? |
|
|
|
| |
|
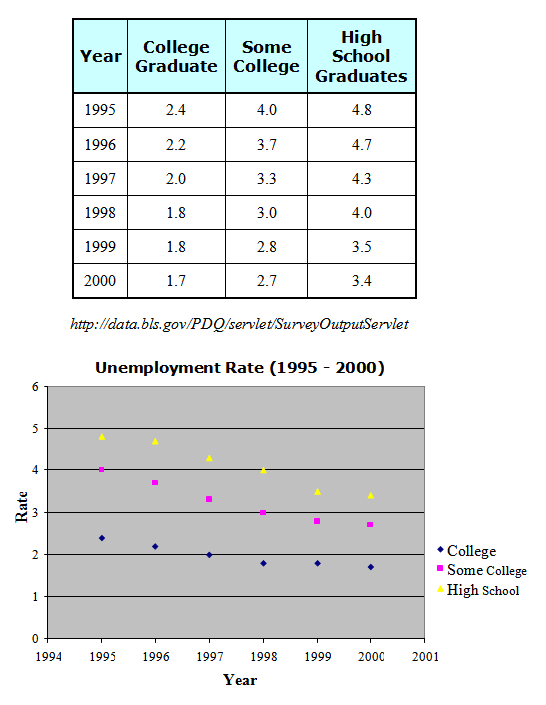
| The table below shows the annual US unemployment rate (in percent) for persons 25 years and older over the years 1995 through 2000. The graph divides the work force into the following groups of people based on education: college graduates with a degree, persons with some college or an associate degree, or high school graduates. The data in the table is also displayed as a line graph. Use the information in the table and the graph to solve the next two problems. |
 |
|
| |
| 32) Which group had the highest unemployment rate over the seven-year period? |
|
|
|
| |
|
| 33) What kind of correlation is displayed for each of the data sets in the graph when comparing the unemployment rate over the seven-year period? |
|
|
|
| |
|
| |
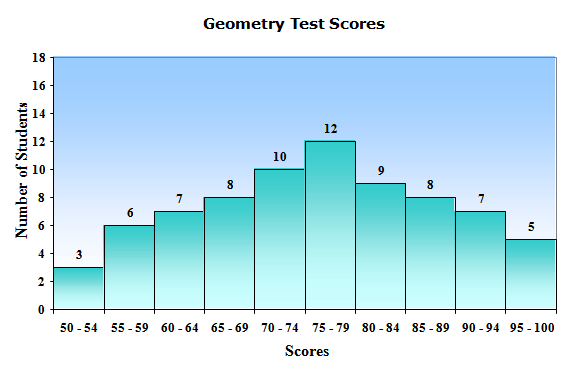
| Refer to the histogram shown below to answer the next four questions. |
 |
|
| |
| 34) How is the data in the histogram distributed? |
|
|
|
| |
|
| |
|
| |
|
| 37) True or False. The teacher could deduce that most of the students understood the concepts presented on the test. |
|
|
|
| |
|
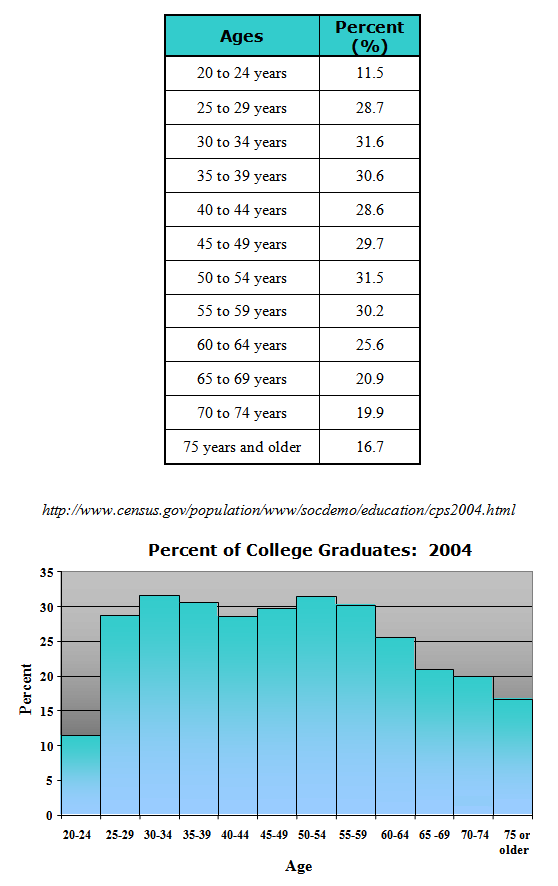
| The data in the table below shows the percent of college graduates in the United States in 2004. It is also displayed in a histogram. Use the information to answer the next three questions. |
 |
|
| |
| 38) What age group has the most college graduates? |
|
4000 character(s) left
Your answer is too long. |
|
| |
|
| |
|
| 40) Why do you think the data is skewed to the right? |
|
4000 character(s) left
Your answer is too long. |
|
|
Attachments |
|
| |
| |
|
| 42) Fill in the blanks about the following types of unbiased samples: A sample that divides the population into similar, non-overlapping groups is a __________ __________ sample. A sample in which people are selected according to an interval of time or items is a __________ __________ sample. A sample in which the people selected to participate are equally likely to be chosen is a __________ __________ sample. |
|
4000 character(s) left
Your answer is too long. |
|
| |
|
| 43) Which type of sample is biased? |
|
|
|
| |
|
| 44) Which type of sample is unbiased? |
|
|
|
| |
|
| For the next five problems, select the specific type of sample that is described. It may help to first determine if the sample is biased or unbiased. |
|
|
| |
| 45) A veterinarian conducts a survey to find out how many pet owners use his services. The survey is conducted at a local pet store near his office. |
 |
|
|
| |
|
| 46) A high school student asks every third person who leaves the band concert if they enjoyed the concert. |
 |
|
|
| |
|
| 47) Five students in twenty different classes at a high school are randomly chosen to evaluate the food in the cafeteria by completing a survey. |
 |
|
|
| |
|
| 48) A group of students are surveyed to determine their favorite kind of music. Each student in the school has an ID number and the school’s computer randomly chooses the students who will be surveyed. |
 |
|
|
| |
|
| 49) A newspaper asks the readers to call and vote for their favorite family restaurant. |
 |
|
|
| |
|
| 50) If you were directed by your school to complete Offline Activities for this course, please enter the information on the Log Entry form. |
|
| No offline activities found |
0 Hour(s) & 0 Minute(s)
|
|
|
Attachments |
|