| 1) Describe how and where to conduct a survey of hospital employees. |
|
4000 character(s) left
Your answer is too long. |
|
| |
|
| 2) Describe how and where to conduct a survey to determine the favored presidential candidate in a town. |
|
4000 character(s) left
Your answer is too long. |
|
| |
|
| 3) What are (a) a convenience sample, (b) a random sample, and (c) a representative sample? |
|
20000 character(s) left
Your answer is too long. |
|
|
Attachments |
|
| 4) How can the size of a sample affect the conclusions based on the sample? |
|
4000 character(s) left
Your answer is too long. |
|
| |
|
| For the next five problems, consider the given data set. |
 |
|
| |
| |
|
| |
|
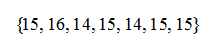
| 7) Explain how the new data point in the previous problem affected the mean in comparison to the mean of the data set in problem #5? |
|
4000 character(s) left
Your answer is too long. |
|
| |
|
| |
|
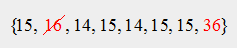
| 9) Again replace 16 with 36 and again find the median of the new data set. Explain how the change in data points affected the median. |
 |
4000 character(s) left
Your answer is too long. |
|
| |
|
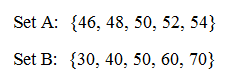
| Consider the two sets of data, and then answer the next three questions. |
 |
|
| |
| 10) Calculate the mean of both data sets. (a) What is the mean of Set A? (b) What is the mean of Set B? |
|
4000 character(s) left
Your answer is too long. |
|
| |
|
| 11) For each set in the previous problem, calculate the median and the range? (a) What are the medians of Set A and Set B? (b) What is the range of Set A and Set B? |
|
4000 character(s) left
Your answer is too long. |
|
| |
|
| 12) Explain how the ranges calculated in the previous problem show a difference in the data of the two sets. |
|
4000 character(s) left
Your answer is too long. |
|
| |
|
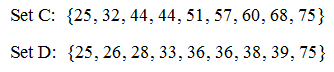
| Consider the two sets of data, and then answer the next four questions. |
 |
|
| |
| 13) For Set C, (a) what is the lower quartile (LQ), (b) what is the middle quartile (Median), and (c) what is the upper quartile (UQ)? |
|
4000 character(s) left
Your answer is too long. |
|
| |
|
| |
|
| 15) For Set D, (a) what is the lower quartile (LQ), (b) what is the middle quartile (Median), and (c) what is the upper quartile (UQ)? |
|
4000 character(s) left
Your answer is too long. |
|
| |
|
| |
|
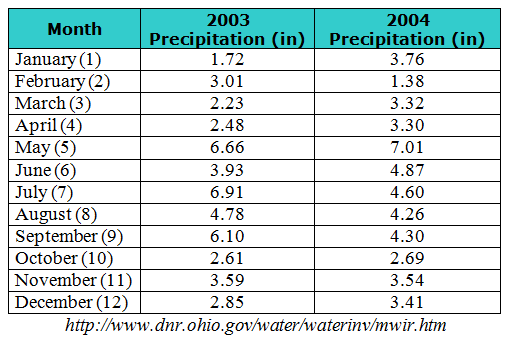
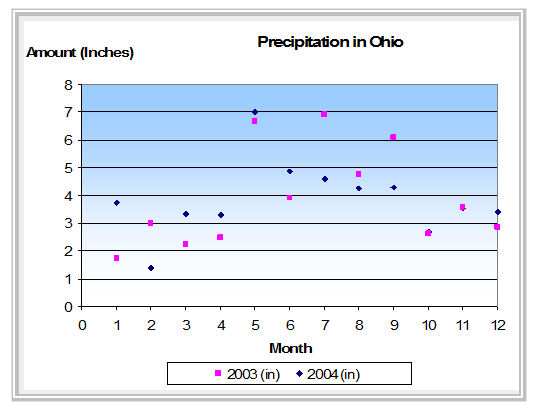
| In Ohio (in the United States of America), the total precipitation (in inches) for each month in the years 2003 and 2004 is listed in the table. Refer to the graph to answer the next ten questions. (Note: There is a link to a copy of the graph in the content section that displays in a pop-up window. This link will make the graph visible at all times while working through the problems. Some adjustments may need to be made to resize the browser window of the questions so that both the questions and the pop-up window are displayed on the screen at the same time.) |
 |
|
| |
| 17) For the precipitation listed in 2003, (a) what is the lower quartile (LQ), (b) what is the middle quartile (Median), and (c) what is the upper quartile (UQ)? Express the answers in hundredths. Be sure to list the data in order from least to greatest before making any calculations. |
|
4000 character(s) left
Your answer is too long. |
|
| |
|
| |
|
| |
|
| |
|
| |
|
| 22) For the precipitation listed in 2004, (a) what is the lower quartile (LQ), (b) what is the middle quartile (Median), and (c) what is the upper quartile (UQ)? Express the answers in hundredths. Be sure to list the data in order from least to greatest before making any calculations. |
|
4000 character(s) left
Your answer is too long. |
|
| |
|
| 23) The median precipitation for Ohio in 2004 is closest to which two months’ precipitation in 2004? |
|
4000 character(s) left
Your answer is too long. |
|
| |
|
| |
|
| |
|
| |
|
| 27) Examine the scatter plot closely from the month of June through the month of December. What kind of relationship is shown between the amount of precipitation and the passing of summer and fall in Ohio during 2003 and 2004? |
 |
|
|
| |
|
| 28) Based on the precipitation in 2003 and 2004 shown in the graph in the previous problem, which season could be considered Ohio’s “dry” season? |
|
|
|
| |
|
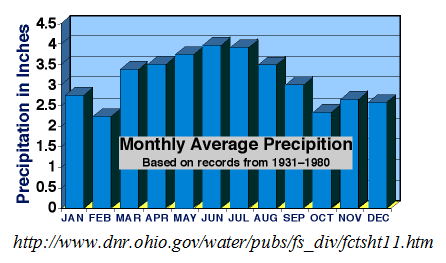
| A bar graph of the monthly average precipitation in Ohio from 1931 through 1980 is shown below. Refer to the graph to answer the next eight questions. (Note: There is a link to a copy of the graph in the content section that displays in a pop-up window. This link will make the graph visible at all times while working through the problems. Some adjustments may need to be made to resize the browser window of the questions so that both the questions and the pop-up window are displayed on the screen at the same time.) |
 |
|
| |
| |
|
| |
|
| |
|
| |
|
| 33) Examine the bar graph closely from the month of June through the month of December. What kind of relationship is shown between the precipitation and the passing of summer and fall in Ohio over the years 1931 through 1980? |
|
|
|
| |
|
| 34) How many months in the years 2003 and 2004 had more precipitation than the highest monthly average of precipitation during the years 1931 through 1980? |
|
|
|
| |
|
| 35) How many months in the years 2003 and 2004 had less precipitation than the lowest monthly average of precipitation during the years 1931 through 1980? |
|
|
|
| |
|
| 36) How does the amount of precipitation in Ohio over the years 2003 and 2004 compare with the amount of precipitation over the years 1932 through 1980? |
|
|
|
| |
|
| |
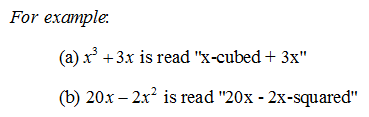
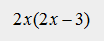
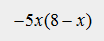
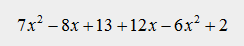
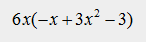
| For the next four problems, simplify the expressions. Write the expressions as they would be read. |
 |
|
| |
| 37) Simplify and write the simplified expression. |
 |
4000 character(s) left
Your answer is too long. |
|
| |
|
| 38) Simplify and write the simplified expression. |
 |
4000 character(s) left
Your answer is too long. |
|
| |
|
| 39) Simplify and write the simplified expression. |
 |
4000 character(s) left
Your answer is too long. |
|
| |
|
| 40) Simplify and write the simplified expression. |
 |
4000 character(s) left
Your answer is too long. |
|
| |
|
| |
|
| |
|
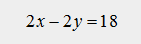
| 43) Is the equation linear or non-linear? |
 |
|
|
| |
|
| 44) Graph the three linear equations, and then describe the change in the graphs as the coefficient of “x” increases. |
 |
4000 character(s) left
Your answer is too long. |
|
| |
|
| |
|
| |
|
| |
|
| |
|
| |
|
| |
|
| 51) If you were directed by your school to complete Offline Activities for this course, please enter the information on the Log Entry form. |
|
| No offline activities found |
0 Hour(s) & 0 Minute(s)
|
|
|
Attachments |
|