| Discrete and Continuous Data |
|
|
| |
| At 7:30 a.m. three balloonists lift off the ground in the gondola of a hot air balloon. They ascend to an altitude of 125 feet where they pause to check the balloon’s controls. |
|
|
| |
| They then rise to an altitude of 350 feet. A circling airplane concerns them, so they descend to 250 feet and wait until it leaves. |
|
|
| |
| Then they lift to their target of 600 feet, later coming down to 450 feet where they pause to take a number of photographs. Afterwards, they descend, touching the ground again at 11:45 a.m. |
|
|
| |
The graph shows a recording of the balloon’s altitude with the passage of time made by an altimeter graphing device.
Hint: You can right-click on the image and "Open image in new tab" so that you can easily view the graph while working through the questions. |
 |
|
| |
| |
|
| |
|
| 3) Did the balloon remain at 600 feet longer than 15 minutes? Provide a reason to support the answer. |
|
4000 character(s) left
Your answer is too long. |
|
| |
|
| 4) What does it mean when the graph is flat? |
|
4000 character(s) left
Your answer is too long. |
|
| |
|
| 5) When was the balloon at 250 feet? Make sure to list all times when the balloon was at this height. |
|
4000 character(s) left
Your answer is too long. |
|
| |
|
| 6) At what altitude did the balloon remain the longest? How long was that? |
|
4000 character(s) left
Your answer is too long. |
|
| |
|
| 7) At what height was the balloon at 9:45 a.m. and what was it doing? |
|
4000 character(s) left
Your answer is too long. |
|
| |
|
| 8) At what height was the balloon at 10:30 a.m. and what was it doing? |
|
4000 character(s) left
Your answer is too long. |
|
| |
|
| |
|
| |
|
| |
|
| |
|
| |
|
| |
|
| 15) Why doesn’t the graph ever go straight up? |
|
4000 character(s) left
Your answer is too long. |
|
| |
|
| 16) Was the balloon landing a safe landing? Explain why or why not. |
|
4000 character(s) left
Your answer is too long. |
|
| |
|
| 17) Is the relationship of the data a FUNCTION between time and altitude? Give a reason to support the answer. |
|
4000 character(s) left
Your answer is too long. |
|
| |
|
| 18) Describe the difference between discrete and continuous data. |
|
4000 character(s) left
Your answer is too long. |
|
| |
|
| 19) Which description compares the graph of discrete data? |
|
|
|
| |
|
| |
|
| |
| 21) What type of correlation does the scatter plot show? |
 |
|
|
| |
|
| 22) In the scatter plot in the previous problem, if a line of best fit was inserted, what type of slope would the line have? (Note: A line of best fit is a straight line located as close as possible to most of the data points.) |
|
|
|
| |
|
| 23) On paper, draw a sketch of a scatter plot with points that have no correlation. Describe the appearance of the scatter plot. |
|
4000 character(s) left
Your answer is too long. |
|
| |
|
| 24) What type of correlation does the scatter plot display? |
 |
|
|
| |
|
Mr. Christman asked 15 of his 8th grade math students to report the number of minutes they had studied for their Math Final Exam. Mr. Christman graded all the exams and created a table to list the study time and the grade percentage scored on the exam. He then graphed the numbers in a scatter plot to show the students how important study time is.
Hint: You can right-click on the image and "Open image in new tab" so that you can easily view the graph while working through the questions. |
 |
|
| |
| 25) What type of relationship does the scatter plot show? |
|
|
|
| |
|
| 26) What can be deduced from this scatter plot? |
|
4000 character(s) left
Your answer is too long. |
|
| |
|
| 27) Did the student that studied the longest score the highest grade? If not, compare that student’s grade with the other students. |
|
4000 character(s) left
Your answer is too long. |
|
| |
|
| 28) Did the student that studied the least score the lowest grade? If not, compare that student’s grade with the other students. |
|
4000 character(s) left
Your answer is too long. |
|
| |
|
| 29) Did the two students who both studied 60 minutes receive the same grade? |
|
4000 character(s) left
Your answer is too long. |
|
| |
|
| 30) Refer to the line of best fit to determine what grade a student who studied for 80 minutes would most likely score. (Note: The line of best fit is the red line passing through and between the graphed points.) |
|
4000 character(s) left
Your answer is too long. |
|
| |
|
| 31) Does Mr. Christman’s graph prove that spending time to study for a test will improve MOST students’ scores? Please Explain |
|
4000 character(s) left
Your answer is too long. |
|
| |
|
| 32) Could Mr. Christman’s graph be considered a typical report of study time verses percentage achieved on a test by any eighth grade math class? |
|
4000 character(s) left
Your answer is too long. |
|
| |
|
| |
| 33) Write the following expression as an algebraic expression: eight times a number “n”, added to the square of the number. |
|
4000 character(s) left
Your answer is too long. |
|
| |
|
| 34) Write the following expression as an algebraic expression: four more than twice a number “x”. |
|
4000 character(s) left
Your answer is too long. |
|
| |
|
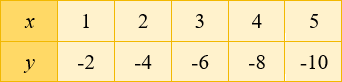
| 35) Is the data given for the function in the table linear or nonlinear? |
 |
|
|
| |
|
| 36) Is the graph of the equation linear or nonlinear? |
 |
|
|
| |
|
| |
|
| 38) Graph the quadratic equation. What is the difference between this graph and the graph of the equation in the previous problem? |
 |
4000 character(s) left
Your answer is too long. |
|
| |
|
| |
|
| |
|
| Refer to the following scenario to answer the next seven problems: On a two-week trip across country, the Wilson family was able to travel an average of 50 miles per hour nine hours per day while sightseeing and sleeping the rest of the day. For each day of the trip, compile the total hours and the total miles that were spent driving. |
|
|
| |
| 41) Print out and complete the table. After completing the table, write the day, hours, and miles for each day in the textbox below. For example: Day 1, 9, 450, Day 2, 18, 900, Day 3 27, 1350, and so on. (To print the table, right-click on the table, and then select Print Picture.) |
 |
20000 character(s) left
Your answer is too long. |
|
|
Attachments |
|
| Refer to the completed table in the previous problem to solve the next six problems. |
|
|
| |
| 42) Write an algebraic equation that uses days (D) and hours (H) to show the number of hours driven. |
 |
4000 character(s) left
Your answer is too long. |
|
| |
|
| 43) Write an algebraic equation that uses days (D) and miles traveled (M) to show the number of miles traveled. |
 |
4000 character(s) left
Your answer is too long. |
|
| |
|
| 44) Make a line graph on paper that shows hours driven (H) in terms of days (D). The horizontal axis will be “Number of Days” and the vertical axis will be “Hours Driven”. Describe the graph. |
|
4000 character(s) left
Your answer is too long. |
|
| |
|
| 45) What kind of the slope does the line in the graph in the previous problem have? |
|
|
|
| |
|
| 46) Make a line graph on paper that shows miles driven (M) in terms of days (D). The horizontal axis will be “Number of Days” and the vertical axis will be “Miles Driven”. Describe the graph. |
|
4000 character(s) left
Your answer is too long. |
|
| |
|
| 47) How are the two graphs referenced in the previous problems similar? |
|
4000 character(s) left
Your answer is too long. |
|
| |
|
| |
|
| 49) Explain why the graph is not a fair representation of the information. |
 |
4000 character(s) left
Your answer is too long. |
|
| |
|
| 50) If you were directed by your school to complete Offline Activities for this course, please enter the information on the Log Entry form. |
|
| No offline activities found |
| 0 Hour(s) & 0 Minute(s) |
|
|
Attachments |
|