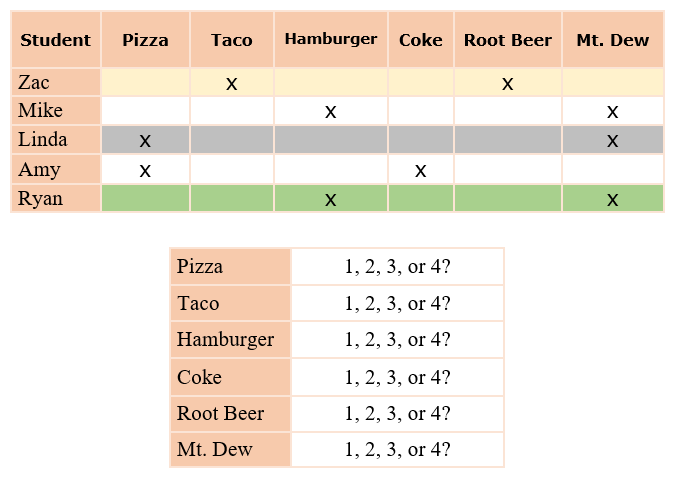
Zack’s mom was ordering dinner for Zack and 4 of his friends. The chart shows what each of the children want to eat and drink. For questions 1 – 6, complete this chart so that mom will know what to order.
Click here to print out the chart.
|
 |
|
| |
| 1) How many students want Pizza?
|
|
|
|
| |
|
| 2) How many students want Tacos?
|
|
|
|
| |
|
| 3) How many students want Hamburgers?
|
|
|
|
| |
|
| 4) How many students want Coke?
|
|
|
|
| |
|
| 5) How many students want Root Beer?
|
|
|
|
| |
|
| 6) How many students want Mt. Dew?
|
|
|
|
| |
|
Line Graph
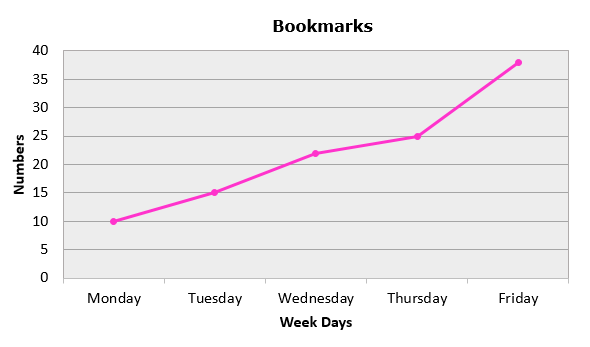
Lisa and Karen made bookmarks to sell. Answer questions 7 – 16 by using the line graph below.
|
 |
|
| |
| 7) How many days did they sell bookmarks?
Click here to view the line graph.
|
|
|
|
| |
|
| 8) What scale did they choose on their line graph?
Click here to view the line graph.
|
|
|
|
| |
|
| 9) How many were sold on Monday?
Click here to view the line graph.
|
|
|
|
| |
|
| 10) How many were sold on Tuesday?
Click here to view the line graph.
|
|
|
|
| |
|
| 11) How many were sold on Wednesday?
Click here to view the line graph.
|
|
|
|
| |
|
| 12) How many were sold on Thursday?
Click here to view the line graph.
|
|
|
|
| |
|
| 13) How many were sold on Friday?
Click here to view the line graph.
|
|
|
|
| |
|
| 14) How many were sold in all?
Click here to view the line graph.
|
|
|
|
| |
|
| 15) If each bookmark sold for 6¢, how much did Lisa and Karen make in all?
Click here to view the line graph.
|
|
|
|
| |
|
| 16) If each bookmark sold for $1, how much did the girls make?
Click here to view the line graph.
|
|
|
|
| |
|
Bar Graph
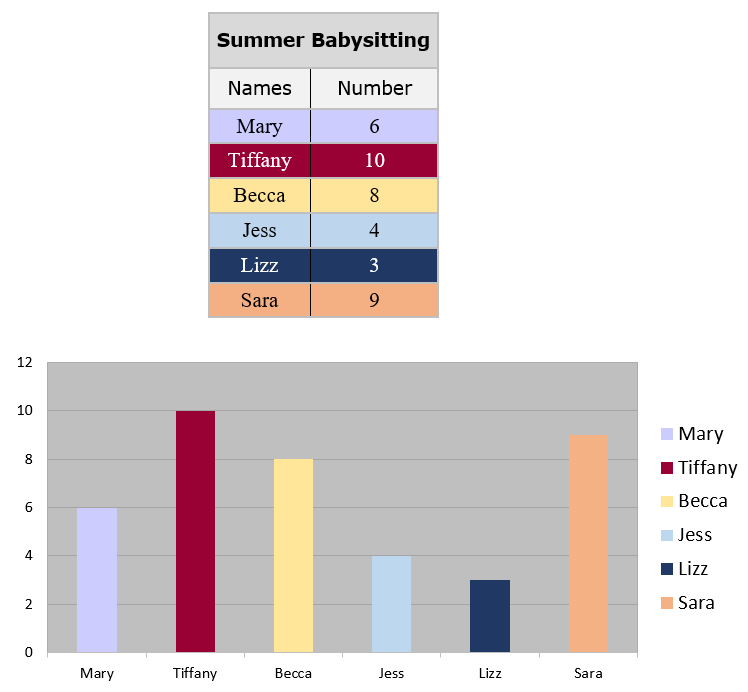
Refer to the following table and bar graph to answer questions 17 – 30.
|
 |
|
| |
| 17) Mary and her friends earned money during the summer babysitting. What is the title of this table?
Click here to view the bar graph.
|
|
|
|
| |
|
| 18) The bar graph below compares the babysitting jobs that the girls had over the summer. What would be a good title of this bar graph?
Click here to view the bar graph.
|
|
|
|
| |
|
| 19) What is the scale for the bar graph?
Click here to view the bar graph.
|
|
|
|
| |
|
| 20) Which girl had the most babysitting jobs?
Click here to view the bar graph.
|
|
|
|
| |
|
| 21) Which girl had the least jobs?
Click here to view the bar graph.
|
|
|
|
| |
|
| 22) Which list has the girls’ jobs in order from greatest to least?
Click here to view the bar graph.
|
|
|
|
|
|
|
|
| |
|
| 23) How many babysitting jobs did Tiffany have?
Click here to view the bar graph.
|
|
|
|
| |
|
| 24) How many jobs did Sara have?
Click here to view the bar graph.
|
|
|
|
| |
|
| 25) How many jobs did Lizz have?
Click here to view the bar graph.
|
|
|
|
| |
|
| 26) How many jobs did Jess have?
Click here to view the bar graph.
|
|
|
|
| |
|
| 27) How many jobs did Mary have?
Click here to view the bar graph.
|
|
|
|
| |
|
| 28) How many jobs did Becca have?
Click here to view the bar graph.
|
|
|
|
| |
|
| 29) How many jobs did the girls have in all?
Click here to view the bar graph.
|
|
|
|
| |
|
| 30) How much money did they make in all?
Click here to view the bar graph.
|
|
|
|
| |
|
Circle Graph
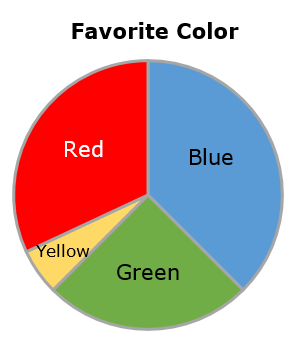
The 3rd graders chose their favorite colors and made a tally table. They placed their results in a circle graph. Use the circle graph to answer questions 31 – 34.
|
 |
|
| |
| 31) Can you tell from the information on the circle graph how many children chose their favorite colors?
Click here to view the circle graph.
|
|
|
|
| |
|
| 32) In this class, what was the favorite color?
Click here to view the circle graph.
|
|
|
|
| |
|
| 33) What was the least favorite color?
Click here to view the circle graph.
|
|
|
|
| |
|
| 34) Which shows the favorite colors from the least to the greatest?
Click here to view the circle graph.
|
|
|
|
|
|
|
|
| |
|
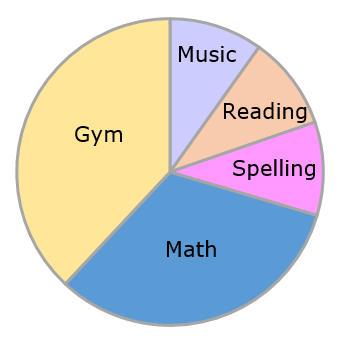
This circle graph shows the favorite subject of a class of third grade students. Use the circle graph to answer questions 35 – 38.
|
 |
|
| |
| 35) What 3 classes had about the same amount of votes?
Click here to view the circle graph.
|
|
|
|
| |
|
| 36) What is the favorite class?
Click here to view the circle graph.
|
|
|
|
| |
|
| 37) What does the blue section stand for?
Click here to view the circle graph.
|
|
|
|
| |
|
| 38) What does the purple section stand for?
Click here to view the circle graph.
|
|
|
|
| |
|
| 39) If you were directed by your school to complete Offline Activities for this course, please enter the information on the Log Entry form. |
|
| No offline activities found |
0 Hour(s) & 0 Minute(s)
|
|
|
Attachments |
|