Bar Graphs
For questions 1 – 5, use the bar graphs to answer the questions.
|
|
|
| |
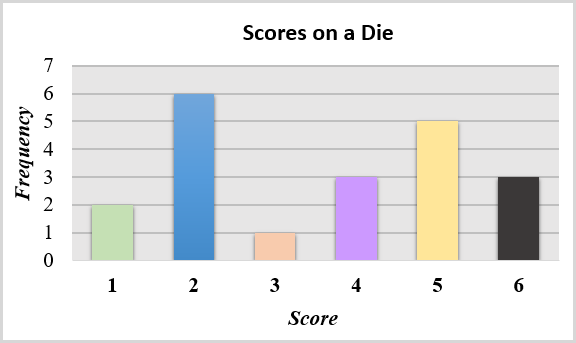
| 1) The bar graph shows the results when a die was thrown a number of times. How many sixes were thrown?
|
 |
4000 character(s) left
Your answer is too long. |
|
| |
|
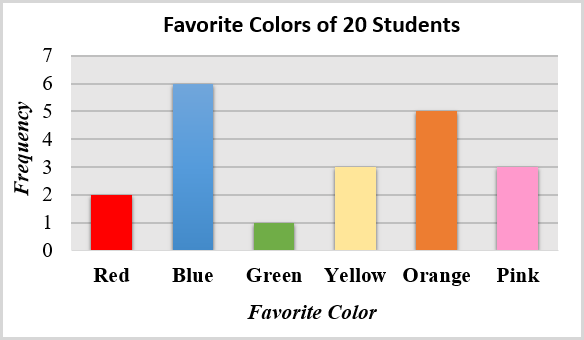
| 2) The bar graph shows the favorite colors of 20 students in a class. How many more of them favored orange than those who favored green?
|
 |
4000 character(s) left
Your answer is too long. |
|
| |
|
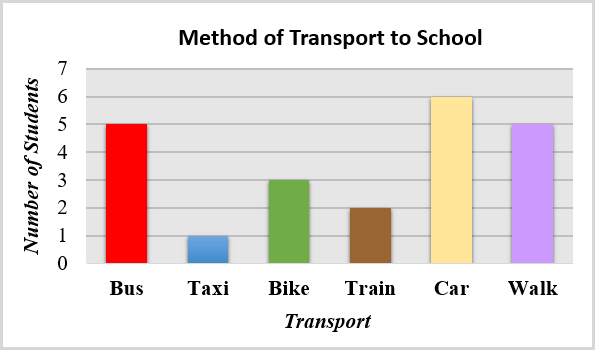
| 3) The bar graph shows the usual method of transport to school for the students in a class. How many students are there altogether in the class?
|
 |
4000 character(s) left
Your answer is too long. |
|
| |
|
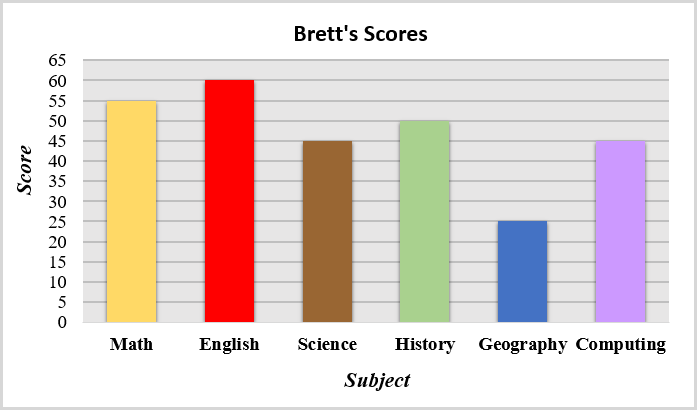
| 4) The bar graph shows the scores Brett obtained in his end of year exams. How many more did Brett score in his best subject than in his worst subject?
|
 |
4000 character(s) left
Your answer is too long. |
|
| |
|
| 5) Using the bar graph from question 4, what was Brett’s score in Computing?
|
 |
4000 character(s) left
Your answer is too long. |
|
| |
|
Use this bar graph to answer questions 6 – 20.
|
 |
|
| |
| 6) What does the blue bar represent?
Click here to view the bar graph.
|
|
|
|
| |
|
| 7) What does the yellow bar represent?
Click here to view the bar graph.
|
|
|
|
| |
|
| 8) What does the burgundy (dark red) bar represent?
Click here to view the bar graph.
|
|
|
|
| |
|
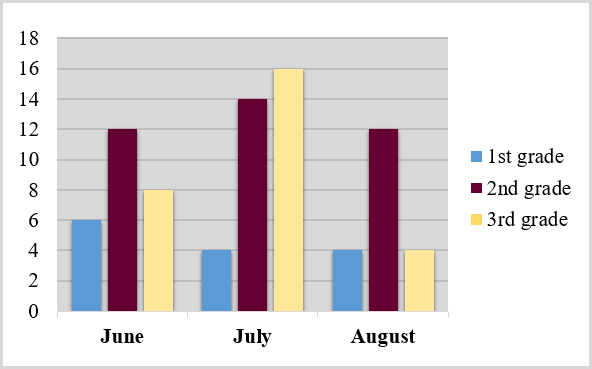
| 9) The graph is showing the number of 1st, 2nd, and 3rd graders that attended a summer reading program at the library. What could be a good title for this bar graph?
Click here to view the bar graph.
|
|
|
|
| |
|
| 10) Since the graph shows the number of 1st, 2nd, and 3rd graders that attended a summer reading program at the library, which sentence best describes what the bars are comparing?
Click here to view the bar graph.
|
|
|
|
| |
|
| 11) According to the graph, which class had more students attending in June?
Click here to view the bar graph.
|
|
|
|
| |
|
| 12) Which class had the least attendance in June?
Click here to view the bar graph.
|
|
|
|
| |
|
| 13) Which class had the most attendance in July?
Click here to view the bar graph.
|
|
|
|
| |
|
| 14) Which class had the least attendance in July?
Click here to view the bar graph.
|
|
|
|
| |
|
| 15) Which class had the most attendance in August?
Click here to view the bar graph.
|
|
|
|
| |
|
| 16) How many 1st graders attended in all three months?
Click here to view the bar graph.
|
|
|
|
| |
|
| 17) How many 2nd graders attended in all three months?
Click here to view the bar graph.
|
|
|
|
| |
|
| 18) How many 3rd graders attended in all three months?
Click here to view the bar graph.
|
|
|
|
| |
|
| 19) Which class had the greatest attendance in September?
Click here to view the bar graph.
|
|
|
|
| |
|
| 20) Which class had the greatest attendance in June, July and August?
Click here to view the bar graph.
|
|
|
|
| |
|
Pictographs
For questions 21 – 25, use the pictographs to answer the questions.
|
|
|
| |
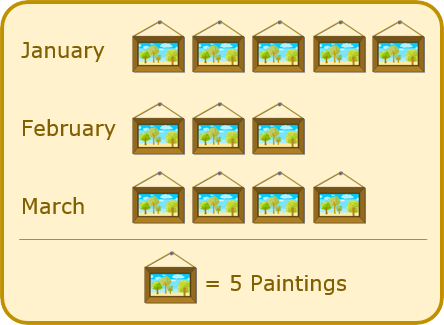
| 21) How many paintings did the painter sell in March?
|
 |
4000 character(s) left
Your answer is too long. |
|
| |
|
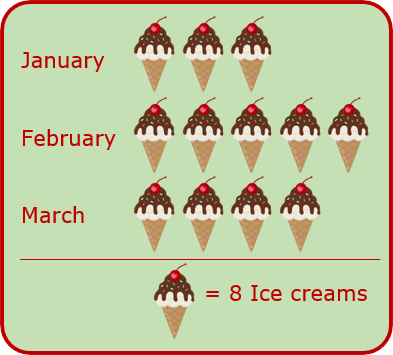
| 22) How many ice creams did the ice cream man sell in January?
|
 |
4000 character(s) left
Your answer is too long. |
|
| |
|
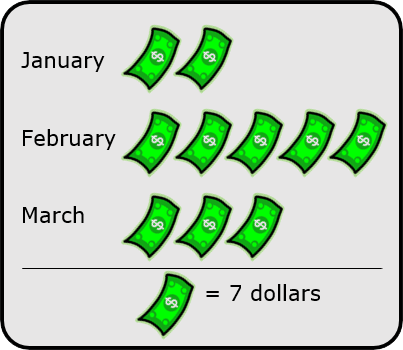
| 23) How many dollars did Jim make doing his chores in February?
|
 |
4000 character(s) left
Your answer is too long. |
|
| |
|
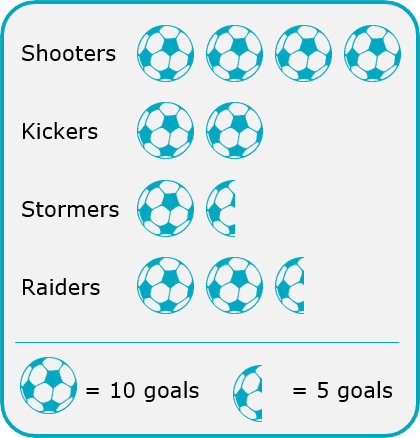
| 24) The pictograph shows the numbers of goals scored by four soccer teams in a season. How many goals did the Stormers score?
|
 |
4000 character(s) left
Your answer is too long. |
|
| |
|
| 25) Using the pictograph from question 24, how many more goals did Shooters score than Raiders?
|
 |
4000 character(s) left
Your answer is too long. |
|
| |
|
Student Activity – Draw a Bar and Pictograph
|
 |
|
| |
| 26) How many people did you survey with the question, “What is your favorite fruit?”
|
|
20000 character(s) left
Your answer is too long. |
|
|
Attachments |
|
| 27) Submit a copy of the bar graph that you created to represent the data that you collected.
|
|
20000 character(s) left
Your answer is too long. |
|
|
Attachments |
|
| 28) Submit a copy of the pictograph that you created to represent the data that you collected.
|
|
20000 character(s) left
Your answer is too long. |
|
|
Attachments |
|
| 29) Which fruit did people like the most?
|
|
20000 character(s) left
Your answer is too long. |
|
|
Attachments |
|
| 30) Which fruit did people like the least?
|
|
20000 character(s) left
Your answer is too long. |
|
|
Attachments |
|
| 31) If you were directed by your school to complete Offline Activities for this course, please enter the information on the Log Entry form. |
|
| No offline activities found |
0 Hour(s) & 0 Minute(s)
|
|
|
Attachments |
|