Pictures
For questions 1 – 4, use the following diagram.
|
 |
|
| |
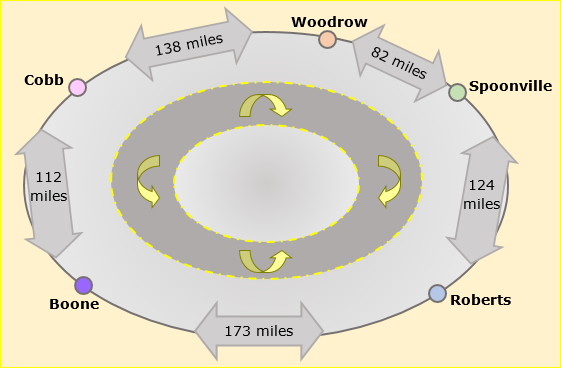
| 1) If Tom stays on the road shown in the drawing, what is the shortest distance from Boone to Woodrow?
Click here to view the diagram.
|
|
|
|
| |
|
| 2) What would the shortest distance be from Roberts to Cobb?
Click here to view the diagram.
|
|
|
|
| |
|
| 3) What would the longest distance be from Roberts to Cobb?
Click here to view the diagram.
|
|
|
|
| |
|
| 4) What would be the shortest distance from Spoonville to Boone?
Click here to view the diagram.
|
|
|
|
| |
|
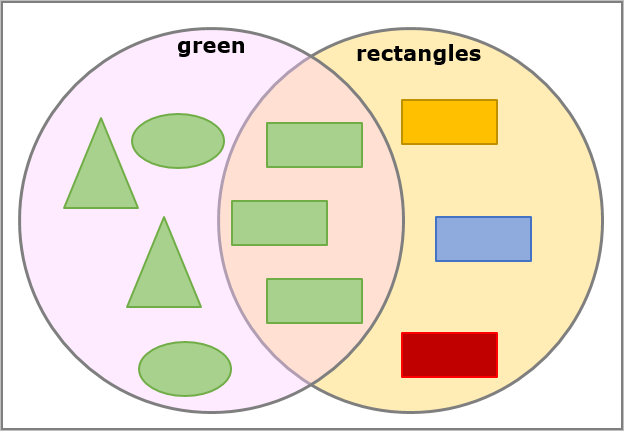
Use the following diagram to answer questions 5 – 7.
|
 |
|
| |
| |
|
| |
|
| |
|
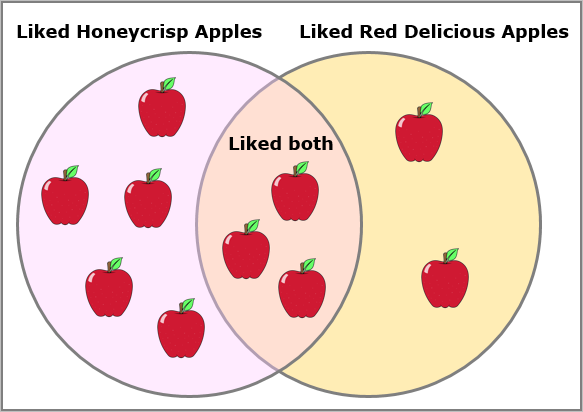
Use the following diagram to answer questions 8 – 10.
|
 |
|
| |
| |
|
| |
|
| |
|
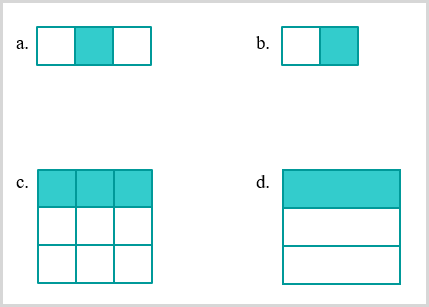
| 11) Which of these figures has 1/3 shaded?
|
 |
|
|
| |
|
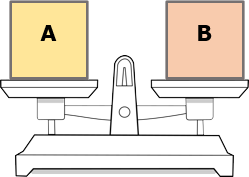
| 12) Box A weighs 5 pounds. How much does box B weigh?
|
 |
|
|
| |
|
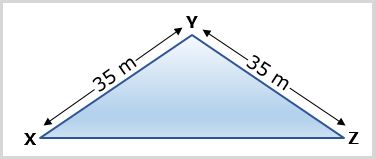
| 13) The perimeter of triangle XYZ is 130 meters. What is the length of segment XZ?
|
 |
|
|
| |
|
| 14) If the hexagon below were cut in half on the dashed line, what shape would each piece be? |
 |
|
|
| |
|
| 15) Who Wants Pizza? All the children are going to share the pizza. We will cut enough pieces so each child can have one, and the pieces should all be the same size. How many pieces should we cut?
|
 |
|
|
| |
|
| |
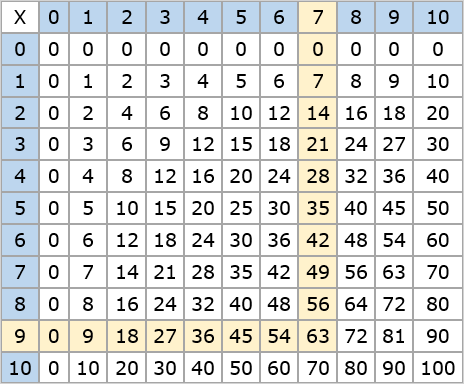
| 16) Use the multiplication table below to locate the product of 9 and 7. Find the row for 9 and the column for 7. The number in the square where the row and column meet is the product.
9 × 7 = _____
|
 |
|
|
| |
|
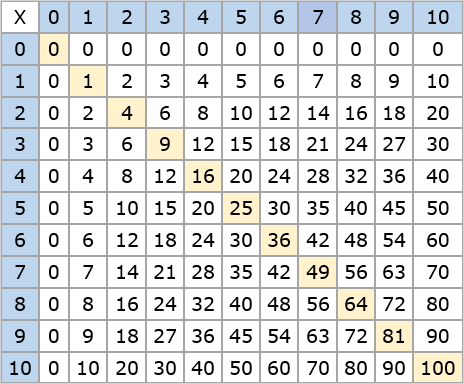
Square Numbers
The multiplication table below shows all the square numbers to 100. Notice that the squares form a diagonal across the multiplication table. Notice also that the products on one side of the diagonal mirror the products on the other side. For questions 17 – 26, select the answers for these multiplication facts.
|
 |
|
| |
| 17) 0 × 0 = _____
Click here to view the multiplication table.
|
|
|
|
| |
|
| 18) 1 × 1 = _____
Click here to view the multiplication table.
|
|
|
|
| |
|
| 19) 2 × 2 = _____
Click here to view the multiplication table.
|
|
|
|
| |
|
| 20) 3 × 3 = _____
Click here to view the multiplication table.
|
|
|
|
| |
|
| 21) 4 × 4 = _____
Click here to view the multiplication table.
|
|
|
|
| |
|
| 22) 5 × 5 = _____
Click here to view the multiplication table.
|
|
|
|
| |
|
| 23) 6 × 6 = _____
Click here to view the multiplication table.
|
|
|
|
| |
|
| 24) 7 × 7 = _____
Click here to view the multiplication table.
|
|
|
|
| |
|
| 25) 8 × 8 = _____
Click here to view the multiplication table.
|
|
|
|
| |
|
| 26) 9 × 9 = _____
Click here to view the multiplication table.
|
|
|
|
| |
|
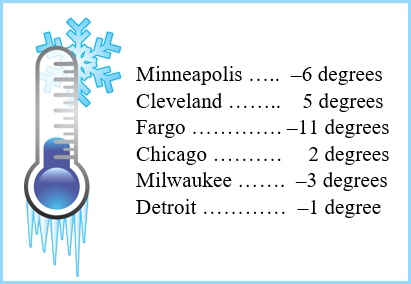
For questions 27 – 29, use the following chart. These were the low temperatures recorded for January 15 in these cities:
|
 |
|
| |
| 27) Which city had the low temperature closest to 0 degrees?
Click here to view the temperatures.
|
|
|
|
| |
|
| 28) Which city had the lowest temperature?
Click here to view the temperatures.
|
|
|
|
| |
|
| 29) Which city had the highest temperature?
Click here to view the temperatures.
|
|
|
|
| |
|
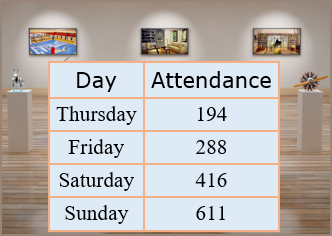
This table shows the number of people who visited the art museum between Thursday and Sunday. Use estimation by rounding to answer the questions 30 – 35. You will need paper and pencil to do your work.
|
 |
|
| |
| 30) To the nearest hundred, how many people visited on Thursday and Friday?
Click here to view the table.
|
|
|
|
| |
|
| 31) About how many people visited Friday and Saturday?
Click here to view the table.
|
|
|
|
| |
|
| 32) About how many people visited on Saturday and Sunday?
Click here to view the table.
|
|
|
|
| |
|
| 33) About how many more people visited Sunday than Thursday?
Click here to view the table.
|
|
|
|
| |
|
| 34) About how many more people visited Sunday than Saturday?
Click here to view the table.
|
|
|
|
| |
|
| 35) To the nearest hundred, how many people visited in the 4 days?
Click here to view the table.
|
|
|
|
| |
|
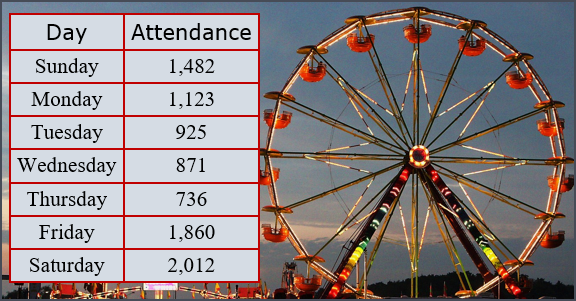
For questions 36 – 40, use the table below that shows the daily attendance at the county fair.
|
 |
|
| |
| 36) Which day were there about 1,100 people in attendance?
Click here to view the table.
|
|
|
|
| |
|
| 37) Which days were there about 2,000 people?
Click here to view the table.
|
|
|
|
| |
|
| 38) Which day were there about 900 people?
Click here to view the table.
|
|
|
|
| |
|
| 39) Which day had the least amount of people in attendance?
Click here to view the table.
|
|
|
|
| |
|
| 40) Why were there so many people attending on Saturday?
Click here to view the table.
|
|
|
|
| |
|
| 41) If you were directed by your school to complete Offline Activities for this course, please enter the information on the Log Entry form. |
|
| No offline activities found |
0 Hour(s) & 0 Minute(s)
|
|
|
Attachments |
|