SUPPLY: THE PRODUCER RULES
Unit
Overview
In
the marketplace, demand explains the consumer side of purchasing decisions;
supply, on the other hand, relates to the producer. Just as consumers choose what and how much to
purchase, sellers decide what and how much to produce, or supply. The law of supply predicts that producers
will supply more of a good or service if the price goes up and less if the
price goes down. As with demand,
economists use supply schedules and supply curves to illustrate this principle
and to analyze data. They also recognize that several factors other than price
influence supply. Let's see how the
supply side of the marketplace works.
How an
Economist Defines Supply
In a
market system, buyers demand goods and services. In other words, demand focuses on the
consumer. However, if consumers are
going to buy products, someone must create them. It is up to the producer to supply the goods
and services that fulfill the wants and needs of the consumer. For this reason, supply, unlike demand, focuses on the seller. An economist defines supply as the amount of goods and services that are available at
various prices within the marketplace.
Producers try to keep the cost of the factors of production low so that
they can achieve their primary goal, which is to make a profit. They come in all shapes and sizes. Large corporations, small businesses, workers
and individuals who sell products online or at flea markets all qualify as
producers. Do friends or neighbors
sometimes hire you to cut grass, shovel snow or babysit? If so, you are actually providing a service
with the hope of making a profit. This
makes you a producer!
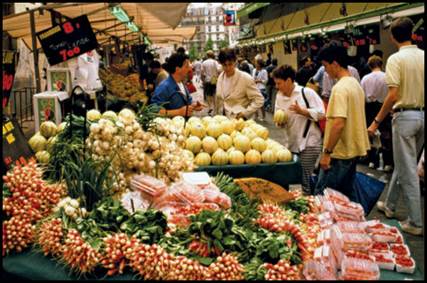
Producers and Consumers at a Produce
Market in Paris, France
![]() Go to Questions 1 through 4.
Go to Questions 1 through 4.
The
Law of Supply
Since
producers are receiving payment for their goods and services, they want to
receive the highest prices for their products.
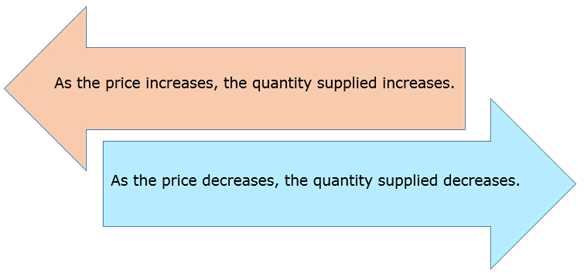
This is the basis for the law of
supply, a principle which states that suppliers offer more products for
sale at higher prices and fewer for sale at lower prices. To make a profit, each individual seller must
decide how much he or she can offer for sale and what price to charge. As long as prices remain high, existing
businesses produce more to earn more.
High prices also provide an incentive,
or reward, for new businesses making similar products to enter the
marketplace. When prices decrease,
existing companies are more likely to offer fewer goods for sale; others may
drop out of the market altogether. In
both cases, the desire for profits
drives the seller's decision-making process.
![]() Go to Questions 5
and 7.
Go to Questions 5
and 7.
Illustrating
the Law of Supply
Rita
is a college student who wants to earn extra money during winter break. She approaches the owner of a local boutique
and asks permission to set up a small coffee bar in front of the store. The owner agrees. As a producer, Rita must decide how much
coffee to make and how much to charge per cup.
According to the law of supply, she wants to sell the most coffee at the
highest price. To accomplish this goal,
Rita thinks like an economist.
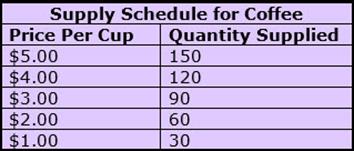
A supply schedule, like a demand
schedule, is a tool used by economists to organize data. It is a listing of the various quantities of
a particular product supplied at all possible prices in the market ceteris
paribus (all other things being equal).
At first glance, it looks just like a demand schedule, but there are
important differences. On a demand
schedule, prices and quantity demanded move in opposite directions. This happens because the demand schedule
supports the law of demand, which states that lower prices increase the
quantity demanded by consumers while higher prices decrease the quantity
demanded. On the supply schedule, price
and quantity supplied move in the same direction. This happens because the supply schedule
supports the law of supply, which states that lower prices decrease the
quantity supplied by sellers while higher prices increase the quantity
supplied. The supply schedule for Rita's coffee business
is pictured below.
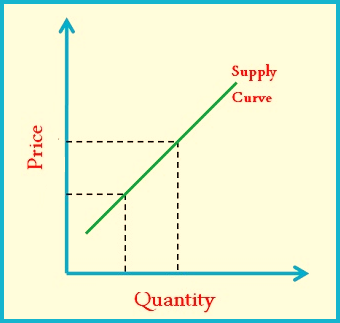
Rita
can also study the relationship between price and quantity supplied by moving
the figures to a graph. This creates a supply curve, which pictures the
quantity supplied at each and every price point present in the market
place. Rita places the lowest possible
price at the bottom of the vertical axis
and the highest possible price at the top.
The horizontal axis shows the
lowest amount of quantity supplied on the left and the highest on the
right. Once Rita plots and connects the
pairs of price and quantity-supplied figures on the graph, the supply curve
appears as pictured below.
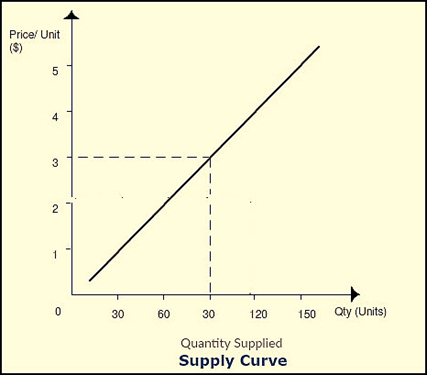
Like
the supply schedule, the supply curve is simply another way to envision the law
of supply. Notice the supply curve
slopes upward to the right as
opposed to the demand curve, which slopes downward to the right. Whether they are analyzing demand or supply,
schedules and curves have similar limitations.
Both assume that all other factors that could affect supply or demand
remain the same. In terms of supply, for
example, the cost of the resources required to make a cup of coffee could
increase, or more sellers could set up coffee shops in the same area. However, if price is the only thing that
changes, we simply move along the curve to a different quantity supplied. As with demand, the curve itself does not
shift in this situation.
![]() Go to Questions 8
through 12.
Go to Questions 8
through 12.
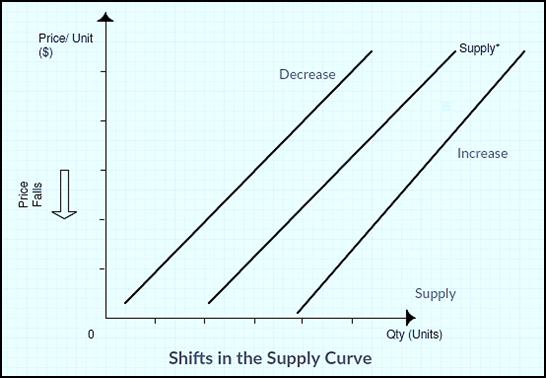
When
Supply Shifts
Changes
in price result in changes in the quantity
supplied but do not shift the entire supply curve as long as nothing else
comes into play. Sometimes, however, certain
circumstances, or determinants of supply, cause suppliers to offer
different amounts of a particular product at all possible price points in the
market. This results in a change in
supply rather than a change in quantity supplied. It also moves the entire supply curve. When supply increases, the supply curve
shifts to the right; when supply decreases, the supply curve shifts to the
left.
Just
as consumer income, taste and other determinants affect demand at all price
levels, a different set of factors impact supply. These include input costs, technology,
production changes, expectations, number of sellers and government
intervention.
Ø Input costs:
Producers use some of the money that they receive for their goods and
services to pay input costs. Input costs cover a wide range of
expenses, including raw materials, transportation, wages and energy. When a manufacturer is forced to pay more for
inputs, supply falls at all price levels.
This happens because the product becomes more expensive to produce. Therefore, producers offer less, and the
entire supply curve shifts to the left.
A decrease in input costs has the opposite effect. In this instance, supply increases, and the
entire supply curve shifts to the right.
Ø Technology:
Technology is another determinant that influences supply. Updated equipment, innovative industrial
processes and new chemicals often improve efficiency, lower costs and increase
production. This enables producers to
create more goods and shifts the supply curve to the right. Although developments in technology usually
increase supply, it sometimes has the opposite effect. The accompanying upgrades can be expensive
and complicated to install. Replacement
parts for new machinery are often difficult to obtain if the equipment breaks
down. As these costs add up, producers
manufacture less, and the supply curve shifts to the left.
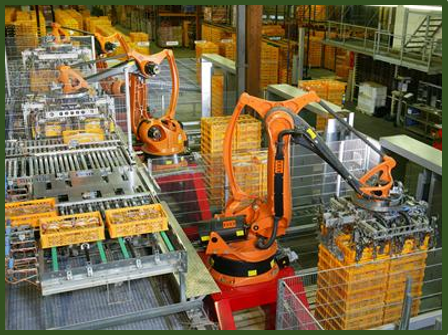
Industrial Robots Moving Products in a German Factory
Ø Production Changes:
Sometimes a company reallocates its resources to produce a different
item that it believes will earn greater profits. This, too, affects supply. For example, a sporting-goods manufacturer
may decide to make fewer footballs and may redirect those same resources to the
production of soccer balls. Therefore, the
number of footballs that the seller is willing to offer in the marketplace
decreases all along the price points of the supply curve. At the same time, the number of soccer balls
that the seller is willing to offer in the marketplace increases throughout the
supply curve.
Ø Expectations:
To achieve their goal of selling at the highest price possible, sellers
often try to anticipate changes in the price of a good or service. These expectations also influence
supply. If producers believe that prices
for certain items will be lower in the future, they may produce and sell as
much as possible immediately. This
results in a short-term increase in supply, and shifts the supply curve to the
right. If, on the other hand, suppliers
expect an eventual increase in prices, they may withhold some of their products
and sell them later. This creates a
temporary decrease in supply, and the supply curve shifts to the left.
Ø Number of sellers:
The number of sellers producing a particular product in the marketplace
is another determinant of supply. As the
amount of firms providing a particular good or service increases, supply
increases. If sellers withdraw from the
market by going out of business or by deciding to make a different product,
less of the good or service is available, and supply, in turn, decreases. Consider this example from the music
industry. Disco music became very
popular in the late 1970s. Some
established groups switched to this style, and new musicians entered the market
to take advantage of potential profits.
This increased the supply of music artists offering disco music. The disco fad, however, did not last
long. Musicians turned to other types of
music, and some left the market altogether.
The supply of disco music and musicians available to play this style
rapidly decreased.

The Disco Craze
of the 1970s
Ø Government Influence:
In the United States, the
government has the authority to affect the supply of many goods and
services. One way in which government
controls supply is through subsidies. A subsidy is a government-issued payment
to encourage or protect a particular business or economic activity. It helps an individual, company or group
lower production costs and remain in the market. American farmers in the
business of providing milk, corn or wheat have sometimes received subsidies to
support their incomes. This enabled them
to continue operating their farms and to remain in the marketplace. While subsidies remain in effect, supplies
increase, and the supply curve for the supported products moves to the right. When the government no longer supports the
subsidy, the supply usually decreases, and the supply curve moves to the left.
Taxes represent another
way in which government affects supply.
Firms view taxes and fees for operating licenses as costs that make
goods and services more expensive to produce.
Therefore, a tax increase on businesses has a negative effect on supply. Tax cuts, on the other hand, have the
opposite impact and increase supply. New
regulations established by law also
influence supply. For example, requiring
certain safety features, such as air bags and back-up cameras, make cars more
expensive to produce. Companies adjust
by manufacturing fewer cars. Because
this happens at every price point in the market, the supply curve shifts to the
left. If regulations are removed or
relaxed, however, the supply curve generally shifts to the right.
![]() Go to Questions 13
through 22.
Go to Questions 13
through 22.
What's
next?
In
the marketplace, buyers, who control demand, and sellers, who control supply,
interact. How can what appears to be
competing interests combine to result in a positive outcome for both sides? What is the key that brings buyers and
sellers together? In the following unit,
you will see what happens when supply meets demand. Before moving on, review the terms found in
Unit 5; then, answer Questions 23 through 30.
![]() Go to Questions 22
through 30.
Go to Questions 22
through 30.
 |
| Unit 5 Main Points Worksheet |
| Unit 5 Law of Supply Worksheet |
| Unit 5 Determinants of Supply Worksheet |