SYSTEMS OF INEQUALITIES
|
Unit Overview
In this unit, you are going to expand on the idea of systems of equations and learn how to graph linear inequalities and systems of linear inequalities. Systems of linear inequalities can be used to establish ranges of possibilities for real-world situations, such as budgeting and cost.
Linear Inequalities
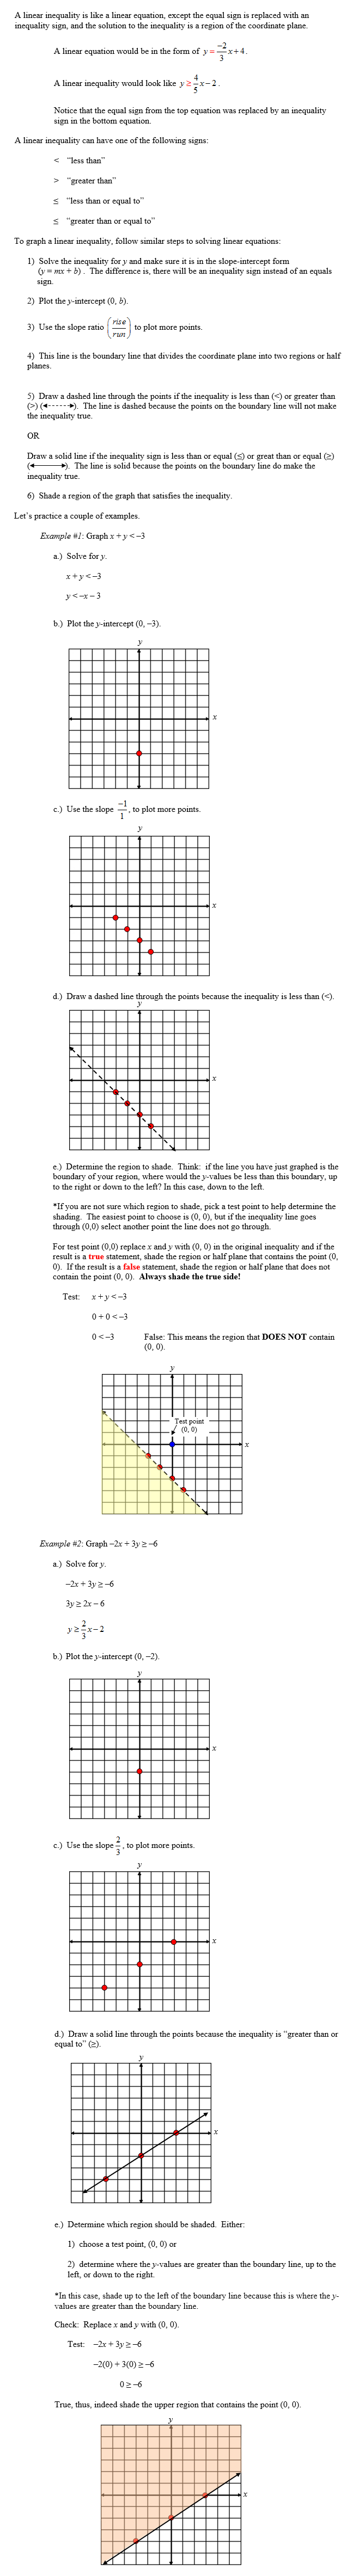 |
Stop! Go to Questions #1-9 about this section, then return to continue on to the next section.
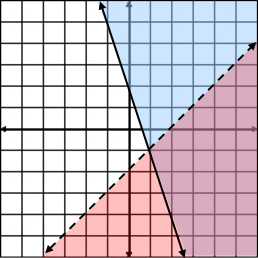
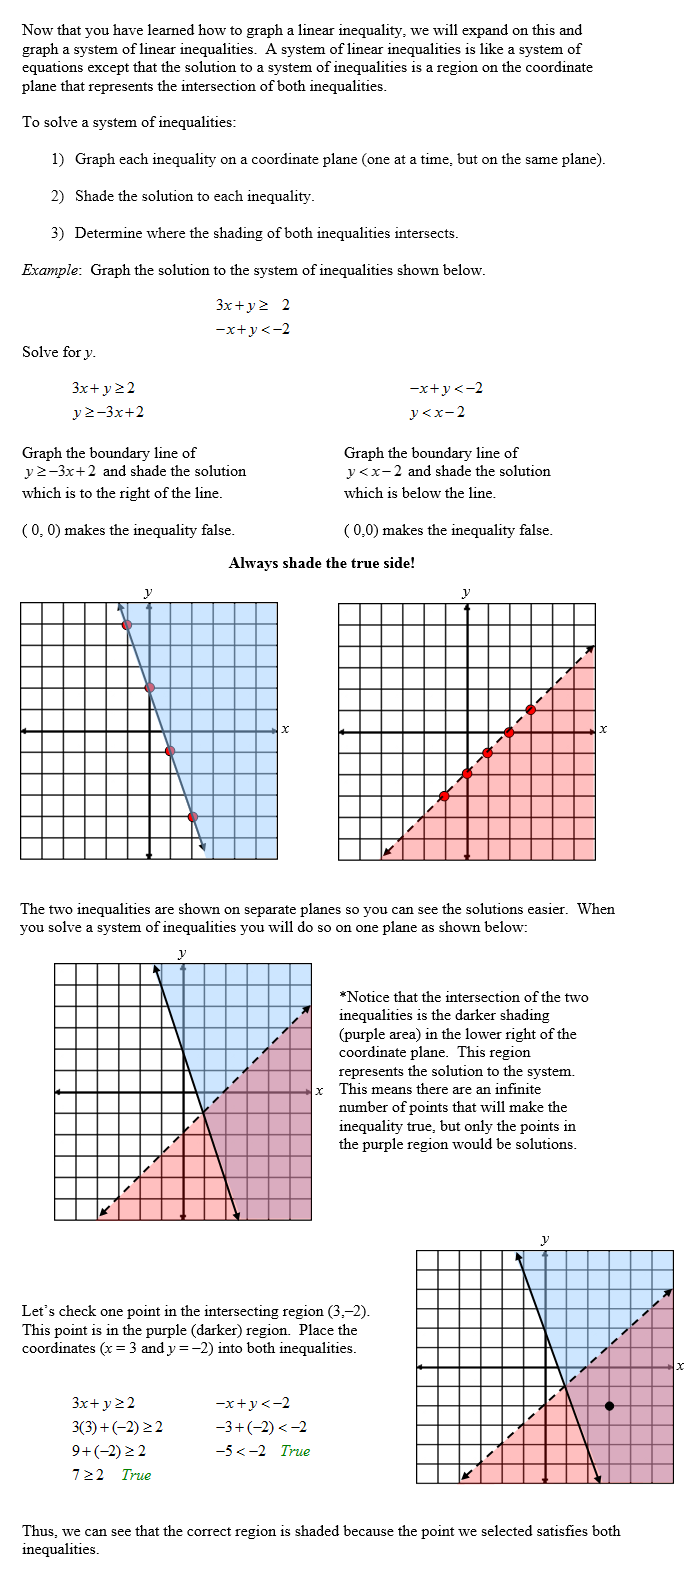
Graphing Systems of Linear Inequalities
 |
Applications of Systems of Equations
When using systems of inequalities in the real world, this is often referred to as Linear Programming. The concept is the same as above. Write and graph each inequality (these are sometimes referred to as constraints) and the solutions to the problem will lie within the shaded region.
Interestingly – when seeking a maximum or minimum value –this will always be one of the vertices of the shaded polygon within the bounded areas. Let’s try an application:
|

Determine which of the following scenarios would be correct based on the graph of the inequalities and shows that Maleigha met her goal.
![]() Maleigha should sell 3 cheese pizzas and 7 pepperoni pizzas.
Maleigha should sell 3 cheese pizzas and 7 pepperoni pizzas.
No, this ordered pair (3, 7) is outside of the shaded region.
"Click here" to check the answer.
"Click here" to view the graph.
![]() Maleigha should sell 10 cheese pizzas and 7 pepperoni pizzas.
Maleigha should sell 10 cheese pizzas and 7 pepperoni pizzas.
Yes, this ordered pair (10, 7) is in the shaded region.
"Click here" to check the answer.
"Click here" to view the graph.
![]() Maleigha should sell 5 cheese pizzas and 11 pepperoni pizzas.
Maleigha should sell 5 cheese pizzas and 11 pepperoni pizzas.
Yes, this ordered pair (5, 11) is on the edge of the shaded region.
"Click here" to check the answer.
"Click here" to view the graph.
Stop! Go to Questions #10-27 to complete this unit.