TRANSFORMATIONS

Unit Overview
This unit is about functions and their transformations. The graph of a function can easily be found by looking at how an equation has been changed from the parent function.  Transformations are used in many disciplines including science, business, advertising and art.

Transformations

 
 Quadratic Polynomials (04:03)
 
Stop! Go to Questions #1-8 about this section, then return to continue on to the next section.


Vertical Translations


Horizontal Translations

You can do this by making a table of values, using a graphing calculator, or using an online resource
such as Math is Fun or Desmos.


You can see this by going to the previous activity: Function Transformations - NLVM
 
 
Stop! Go to Questions #9-15 about this section, then return to continue on to the next section.


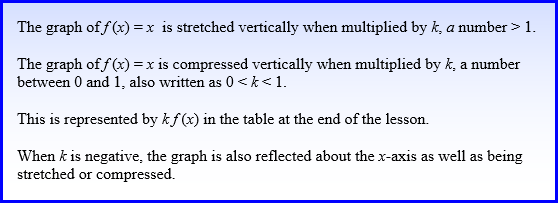
Vertical Stretches and Compressions


Try graphing these at: Math is Fun.

Type in y=x^2 for the blue equation and y=3x^2 for the red equation. The ^ symbol is found above the 6 key and denotes an exponent.   You can also do this for the equations in example 4.  After you have typed both in, the graphs appear. You should notice that the red graph is much steeper than the blue graph.  We call this a stretch because the y values are higher for the same x-values. Now, under the red y, you will see a + and – button. Clicking these allows you to delete an equation or add additional equations. Click the + button. You should now see a green y= . You should now be able to input a 3rd equation. We are going to enter a new equation of  y=(1/3) x2. How does the green graph compare to the others? Is it narrower? Wider?   In case you are having trouble, click here to see the graphs.


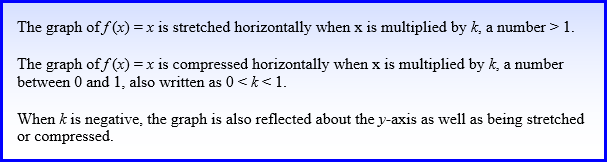
You should notice that the green graph is wider. We call this a vertical compression because the y-values are smaller for the same x-values.


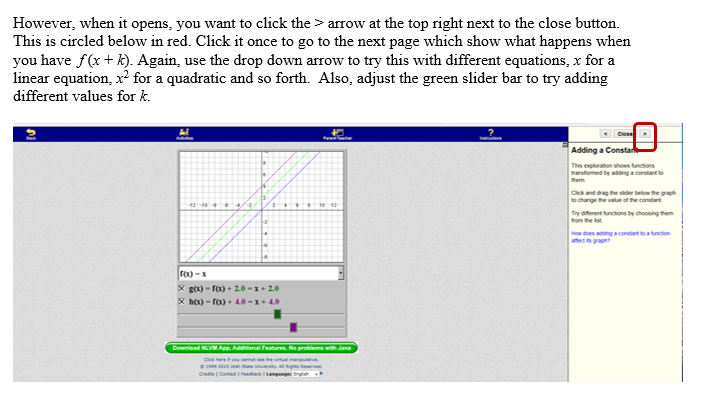
If you would like to see this using the activity we used earlier, go to Function Transformations - NLVM and make sure to click the forward arrow > as we did before until you reach "Multiplying by a Constant."


What happens if k is negative? What if we had –3 f (x)?  Try it! Click the + button under the green y to add another function. Then type y = –3x^2.


You get a mirror image of 3 f (x).  This is called a reflection about the x-axis.  You still have a vertical stretch but in the opposite direction.


Horizontal Stretches and Compressions


Click here to see the answer.

Did you see that the green equation is a mirror image across the y-axis?


To better see how all of this works, you are encouraged to make up equations and type them in the website we have been using and compare them. If you would prefer, you can also try the graphing calculator at Desmos.  It works very well also.

You can see further examples at Math is Fun.  

And if you want to go deeper into this topic, try Parent Functions and Transformations.


Stop! Go to Questions #16-32 to complete this unit.


Below are additional educational resources and activities for this unit.
 
Rotations
 
Translations
 
Transformations of Graphs