PDF

SYSTEMS OF INEQUALITIES


Unit Overview
In this unit, you are going to expand on the idea of systems of equations and learn how to graph linear inequalities and systems of linear inequalities.  Systems of linear inequalities can be used to establish ranges of possibilities for real-world situations, such as budgeting and cost.


Linear Inequalities

A linear inequality is like a linear equation, except the equal sign is replaced with an inequality sign, and the solution to the inequality is a region of the coordinate plane. 

A linear equation would be in the form of y = x + 4.
 
A linear inequality would look like y x – 2.
 
Notice that the equal sign from the top equation was replaced by an inequality sign in the bottom equation.

A linear inequality can have one of the following signs:

<    “less than”


>    “greater than”


≤    “less than or equal to”


≤    “greater than or equal to”


To graph a linear inequality, follow similar steps to solving linear equations:

1)  Solve the inequality for y and make sure it is in the slope-intercept form (y = mx + b) .  The difference is, there will be an inequality sign instead of an equals sign. 
 
2)  Plot the y-intercept (0, b).
 
3)  Use the slope ratio to plot more points.
 
4)  This line is the boundary line that divides the coordinate plane into two regions or half planes. 
 
5)  Draw a dashed line through the points if the inequality is less than (<) or greater than (>) ().  The line is dashed because the points on the boundary line will not make the inequality true.

OR

Draw a solid line if the inequality sign is less than or equal (≤) or great than or equal (≥) ().  The line is solid because the points on the boundary line do make the inequality true.
 

6)  Shade a region of the graph that satisfies the inequality.


Let’s practice a couple of examples.

Example #1:  Graph x + y < 3

a.)  Solve for y.

x + y < 3
 
y < –x – 3
 
b.)  Plot the y-intercept (0, 3).

 
c.)  Use the slope , to plot more points.

 
d.)  Draw a dashed line through the points because the inequality is less than (<).

 
e.)  Determine the region to shade.  Think:  if the line you have just graphed is the boundary of your region, where would the y-values be less than this boundary, up to the right or down to the left? In this case, down to the left.
 
*If you are not sure which region to shade, pick a test point to help determine the shading.  The easiest point to choose is (0, 0), but if the inequality line goes through (0,0) select another point the line does not go through. 
 
For test point (0,0) replace x and y with (0, 0) in the original inequality and if the result is a true statement, shade the region or half plane that contains the point (0, 0).  If the result is a false statement, shade the region or half plane that does not contain the point (0, 0). Always shade the true side!

Test:       x + y < 3


  0 + 0 < 3


  0 < 3 False: This means the region that DOES NOT contain (0, 0).


Example #2:  Graph –2x + 3y6

a.)  Solve for y.

2x + 3y6
 

3y ≥ 2x – 6

 
y x – 2
 
b.)  Plot the y-intercept (0, 2).

 
c.)  Use the slope , to plot more points.

 
d.)  Draw a solid line through the points because the inequality is “greater than or equal to” (≥).

 
e.)  Determine which region should be shaded.  Either:

1)  choose a test point, (0, 0) or


2)  determine where the y-values are greater than the boundary line, up to the left, or down to the right.

 
*In this case shade up to the left of the boundary line because this is where the y-values are greater than the boundary line. 
 
Check:  Replace x and y with (0, 0).

Test:      

2x + 3y6


2(0) + 3(0) ≥ 6

   
                   0 ≥ 6
 
True, thus, indeed shade the upper region that contains the point (0, 0).
 

Quicktime_Video_Icon  Two Lines (11:59)

Stop!  Go to Questions #1-9 about this section, then return to continue on to the next section.


Graphing Systems of Linear Inequalities

Now that you have learned how to graph a linear inequality, we will expand on this and graph a system of linear inequalities.  A system of linear inequalities is like a system of equations except that the solution to a system of inequalities is a region on the coordinate plane that represents the intersection of both inequalities.

To solve a system of inequalities:

1)  Graph each inequality on a coordinate plane (one at a time but on the same plane).
 
2)  Shade the solution to each inequality.
 
3)  Determine where the shading of both inequalities intersects.

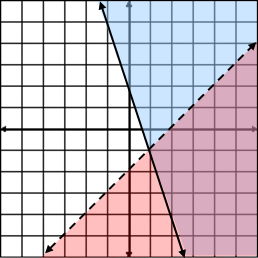
Example:  Graph the solution to the system of inequalities shown below.

3x + y ≥ 2
 

x + y < –2


Solve for y

3x + y ≥ 2
x + y < –2
y ≥ –3x + 2
y < x – 2
     
Graph the boundary line of y ≥ –3x + 2 and shade the solution which is to the right of the line.   Graph the boundary line of y < x – 2 and shade the solution which is below the line.
     
(0, 0) makes the inequality false.   (0, 0) makes the inequality false.
     
Always shade the true side!


The two inequalities are shown on separate planes so you can see the solutions easier.  When you solve a system of inequalities you will do so on one plane as shown below:

  *Notice that the intersection of the two inequalities is the darker shading (purple area) in the lower right of the coordinate plane.  This region represents the solution to the system.  This means there are an infinite number of points that will make the inequality true, but only the points in the purple region would be solutions.

Let’s check one point in the intersecting region (3,–2).  This point is in the purple (darker) region.  Place the coordinates (x = 3 and y = –2) into both inequalities.

3x + y ≥ 2   x + y < –2
3(3) + (–2) ≥ 2   –3 + (–2) < –2
9 + (–2) ≥ 2   –5 < –2  True
7 ≥ 2  True    


Thus, we can see that the correct region is shaded because the point we selected satisfies both inequalities. 

Quicktime_Video_Icon  The Intersection (03:58)

Stop!  Go to Questions #10-18 about this section, then return to continue on to the next section.


Applications of Systems of Equations

When using systems of inequalities in the real world, this is often referred to as Linear Programming.  The concept is the same as above.  Write and graph each inequality (these are sometimes referred to as constraints) and the solutions to the problem will lie within the shaded region.   

Interestingly – when seeking a maximum or minimum value –this will always be one of the vertices of the shaded polygon within the bounded areas.  Let’s try an application: 

Maleigha is selling pizzas to raise money for prom.  Cheese pizzas cost $10 and pepperoni pizzas cost $12.  She must sell at least 5 of each kind, and she wants to sell at least $150 worth of pizzas.  Write linear inequalities based on the number of pizzas and the value of the pizzas, and then graph.

First:  Determine the variables that will be used to represent quantities of the different pizzas presented in the problem.   

Let x be the number of cheese pizzas.  Let y be the number of pepperoni pizzas.

Next
:  Write inequalities based on the the number of pizzas and graph them.

Use ≥ to represent "at least."
 
She must sell at least 5 of each kind...

represents "at least 5 cheese pizzas"
 

Click here to view the graph.


represents "at least 5 cheese pizzas"
 

Click here to view the graph.


Next:  Write an inequality based on the value of the pizzas and graph it.

Cheese pizzas cost $10... 
 
10 represents the value of the cheese pizzas
 
...  and pepperoni pizzas cost $12
 
12 represents the value of the pepparoni pizzas
 
...  and she wants to sell at least $150 worth of pizzas.
 

 Put all of the values together. 

 
Click here to view the graph.

Finally:  Graph the inequalities in one plane.

Click here to view the graph.

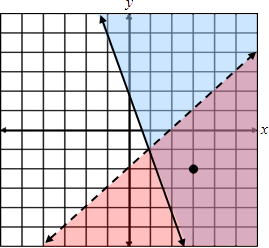
Determine which of the following scenarios would be correct based on the graph of the inequalities and shows that Maleigha met her goal.

question1Maleigha should sell 3 cheese pizzas and 7 pepperoni pizzas.

No, this ordered pair (3, 7) is outside of the shaded region.

"Click here" to check the answer.


"Click here" to view the graph.


question1Maleigha should sell 10 cheese pizzas and 7 pepperoni pizzas.

Yes, this ordered pair (10, 7) is in the shaded region.

"Click here" to check the answer.


"Click here" to view the graph.


question1Maleigha should sell 5 cheese pizzas and 11 pepperoni pizzas.

Yes, this ordered pair (5, 11) is on the edge of the shaded region.

"Click here" to check the answer.


"Click here" to view the graph.

Quicktime_Video_Icon  Solving Systems of Inequalities (05:05)

Stop!
  Go to Questions #19-32 to complete this unit.


Below are additional educational resources and activities for this unit.
 
In the activity below, there are 8 systems of linear inequalities (some in slope-intercept form and some in standard form). Match the graphs to the correct inequalities.
Systems of Linear Inequalities
 
Solving Systems of Inequalities