LINEAR FUNCTIONS
 |
Unit Overview
In this unit, you will study linear functions which are the most basic algebraic functions. You will also learn how to find the slope, or steepness of a line given a graph. The unit will conclude with rate of change which is just slope in terms of real-life problems and direct variation.
Linear Functions and Graphs
| Ordered Pair: the x- and y- coordinates that give the location of a point in a coordinate plane, indicated by two numbers in parentheses (x, y). |
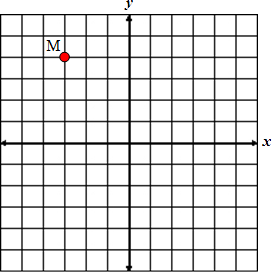
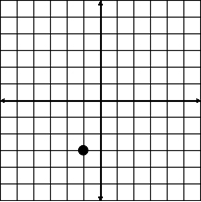
Example #1: What is the location of Point M if each line in the grid represents one unit?
|
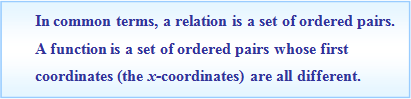
| Relation: a pairing of a set of numbers generally represented as a set of ordered pairs. |
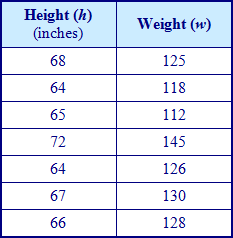
Example #2: State the ordered pairs shown in the table (h, w).
The set of ordered pairs (h, w) represented in this table would be:
*Notice in this example that there are repeated numbers in the height column. Because of this, the chart and set of ordered pairs only represents a relation.
|
| Function: a pairing between two sets of numbers in which each element in the first set is paired with exactly one element of the second set. |
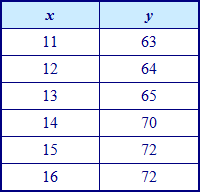
Example #3: State the ordered pairs shown in the table (x, y).
The set of ordered pairs (x, y) represented in the table would be:
*Notice in this example that there are no repeated values in the first column. Because of this, the chart and the set of ordered pairs represent a function. |
 |
| In a relation, the set of first coordinates, (x-values) are called the domain of the relation. The set of second coordinates, (y-values) are called the range. From Example #3 above:
*Notice that the number 72 is only listed once in the range. If a number is repeated in a relation, it is only listed once in the domain or range. **Notice that the domain and range are listed in order from least to greatest. |
Application of Domain and Range |
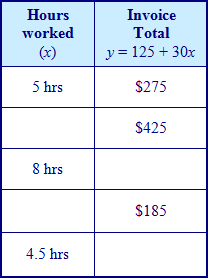
Fill in the chart with appropriate domain (x) and range (y) values based on the given terms of Elton's Electronic Company for the employee.
|

![]() State the domain values.
State the domain values.
Domain: 2, 4.5, 5, 8, 10
"Click here" to check the answer.
![]() State the range values.
State the range values.
Range: 185, 260, 275, 365, 425
"Click here" to check the answer.
*Note: The domain and range values are stated in order from least to greatest.
![]() Would 3.75 hours be a possibility for the domain? Why or why not?
Would 3.75 hours be a possibility for the domain? Why or why not?
No, because the hours are rounded to the nearest half hour.
"Click here" to check the answer.
![]() Would $1325 be a possibility for the range?
Would $1325 be a possibility for the range?
No
"Click here" to check the answer.
*Note: This amount, $1325 would equal 40 hours of work. [125 + 30(40)]. The employee is not permitted to work more than 38 hours in one week.
Example #5: Determine whether the following relation is a function, and then state the domain and range.
|
An equation in two variables can have an infinite number of solutions which can be represented by ordered pairs.
To determine a solution to an equation in two variables, substitute the given coordinate into the equation and solve for the other coordinate.
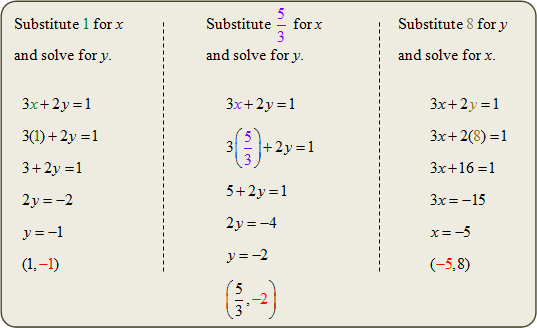
Example #6: Complete each ordered pair so that it is a solution to 3x + 2y = 1.
|
Stop! Go to Questions #1-17 about this section, then return to continue on to the next section.
Slope and Rate of Change
The slope of a line describes the steepness of the line. The slope of a line is a rate of change. A rate of change describes how one quantity changes in relation to another. The slope of a line is the ratio of vertical rise to horizontal run.
To find the slope of a line graphed on a coordinate plane:
| - Identify a point on the line. - From that point, move up or down until you are directly across from the next point. - Move left or right to the next point. |
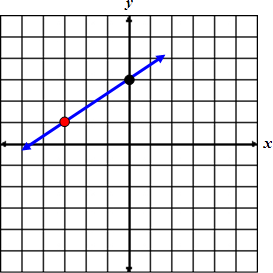
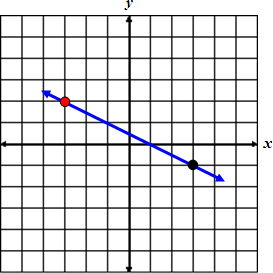
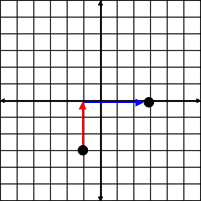
Example #1: From the graph below, determine the slope of the line.
|
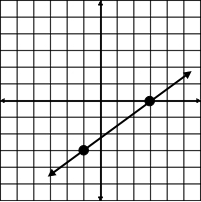
Example # 2: From the graph below, determine the slope of the line.
|
Click here to view more examples of slope.
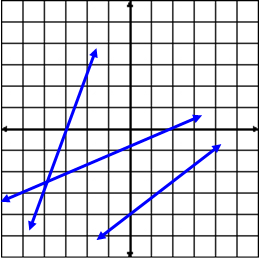
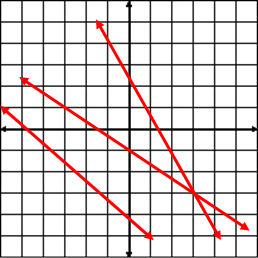
On a coordinate plane, there are lines that have positive slopes and lines that have negative slopes. Below is an illustration of both.
 |
 |
Lines with positive slopes rise to the right. |
Lines with negative slopes rise to the left. |
At this point, we are going to learn how to find the slope of a line by using two points that lie on the line.
The definition of slope states that given two points, (x1, y1) and (x2, y2), the formula for finding the slope of a line containing these points is:
| m = |
*Notice, this is the vertical change over the horizontal change. Slope is a rate of change that describes the change in y in relation to the change in x.
Example #3: Find the slope of the line containing the point A(–2, –6) and B(3, 5).
|
Example # 4: Find the slope of the line containing the point C(5, –2) and D(8, –2).
|
Example #5: Find the slope of the line containing the point E(9, 4) and F(9, 1).
|
Stop! Go to Questions #18-29 about this section, then return to continue on to the next section.
Graphing a Line on a Coordinate Plane Using a Point and the Slope
Example #1: Graph the line containing the point (–1, –3) and having a slope of m =
|
Example: Now you try – Click here to begin the steps in graphing a line through (3,-4) with a slope of 2/3.
| Example #2: |
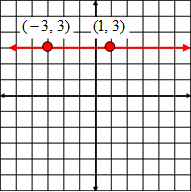 |
The y-coordinate for every point on a horizontal line is the same. Choose two points on the line and use the slope formula m = m = The slope of every horizontal line is 0. |
| Example #3: |
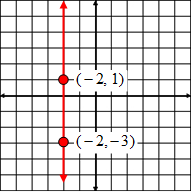 |
The x-coordinate for every point on a vertical line is the same. Choose two points on the line and use the slope formula m = m = The slope of every vertical line is undefined! |
Stop! Go to Questions #30-33 about this section, then return to continue on to the next section.
Rate of Change
Rate of change is directly related to slope and can be found using the following formula:
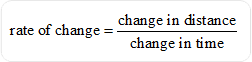 |
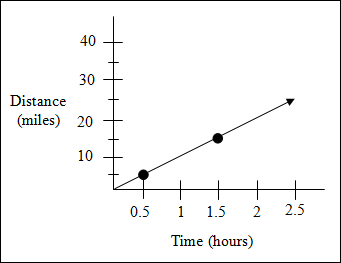
Example 1: The graph shows the distance a bicyclist travels at a constant speed. Find the speed of the bicyclist.
Select two points and use the slope formula.
|
Now, let’s examine a rate of change from a chart and determine what the rate of change means for this problem.
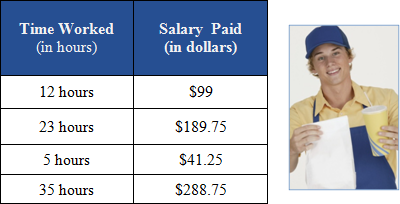
| Example 2: Brenton works at a local fast food restaurant and is examining his recent pay checks (amounts do not reflect any type of deductions). Brenton's time worked and salary is shown in chart below.
|
![]() Do these ordered pairs represent a function?
Do these ordered pairs represent a function?
Yes, the domain does not repeat.
"Click here" to check the answer.
Let’s find the rate of change using Brenton's information: |
Let’s try another set of data points: |
| This procedure can be done with any of the data points in the chart.
So what does the 8.25 represent in terms of the data? In this problem, the top number is the change in dollars earned and the bottom number is the change in hours worked.In mathematics, the symbol Δ (delta) means change. Thus, the 8.25 represents the dollars per hour that Brenton is being paid to work at the local fast food restaurant. Brenton makes $8.25 per hour for his wages. (rate of change is dollars / hour) |
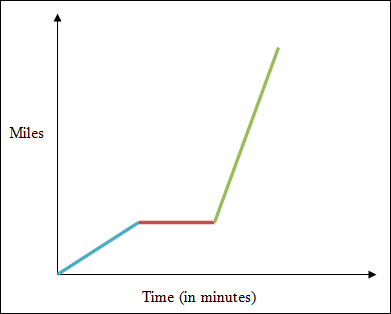
Example 3: To make the commute to work, Brenton must ride a bus part of the way and walk part of the way. Look at the graph below and describe what the graph represents in terms of Brenton's commute to work and rate of change. Think about what transpires realisticallyon his commute.
Solution: Notice that the first line in the graph shows a rate of change that is not as great as shown elsewhere in the graph. This line represents Brenton's walk to the bus stop. Brenton must then wait for the bus at the bus stop. At this point, the line in the graph is flat; time is increasing but the miles are not. The last line in the graph shows the greatest rate of change. This line represents Brenton's ride on the bus (the bus travels faster – more miles per minute than walking or waiting). The rate of change would be miles per minutes in this problem. |
Stop! Go to Questions #34-37 about this section, then return to continue on to the next section.
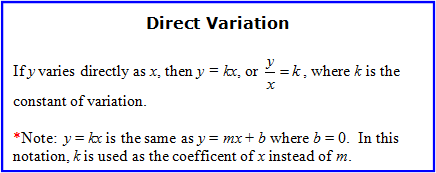
Direct Variation
One type of rate of change is known as direct variation. Direct variation can be looked at as a form of y = mx + b where the y-intercept is always 0.
 |
Example 1: If y varies directly as x and y = 6 when x = 0.3, find the constant of variation and write an equation of direct variation.
|
| Example 2: Bob's salary can be calculated using the equation y = 7.65x + 35. Brenton's salary is calculated using the equation y = 8.25x. For both persons, x represents the time worked and y represents the amount earned. Which person's salary is an example of direct variation and why? Solution: Brenton's salary equation is direct variation because it is in the form y = kx with the constant (k) of 8.25. Bob’s salary equation is not direct variation because an amount is added (probably tips or other type of incentive). |
The cost for 400 minutes is $16.00. |

Stop! Go to Questions #38-45 to complete this unit.