MORE TRIGONOMETRY
 |
Unit Overview
In this unit, you will learn how to graph the sine, cosine and tangent functions. You will also learn how changes in the standard equation, can change the amplitude and period of the graph. The Pythagorean Identity will be proven and then used to find trigonometric values.
Graphing the Characteristic Curves of Trigonometric Functions- Sine, Cosine and Tangent
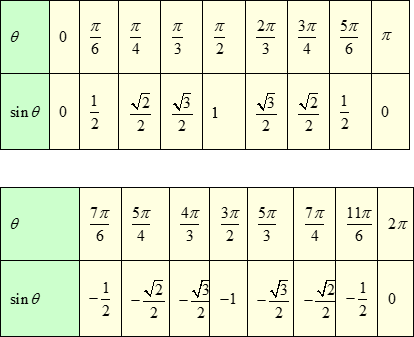
The trigonometric functions can be graphed on a rectangular coordinate system by plotting points whose coordinates belong to the function. The table below shows the values of the sine function for the critical values of θ where 0 ≤ θ ≤ 2π.
 |
 |
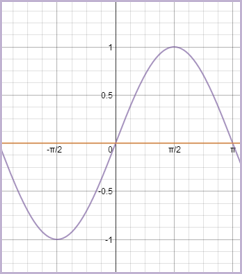
Each of these values can be paired and graphed using points on the xy-plane by allowing “θ” to be placed on the x-axis and the sin θ to be graphed on the y-axis in the following manner:
 |
If all the values in the table are graphed in this manner the following standard graph of the sin θ is obtained:
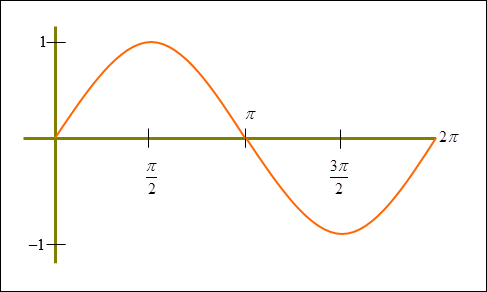 |
Since the domain of the sine function is the real numbers, the graph of y = sin θ is drawn by repeating the portion shown in the graph above. A portion of the graph of y = sin θ is shown below:
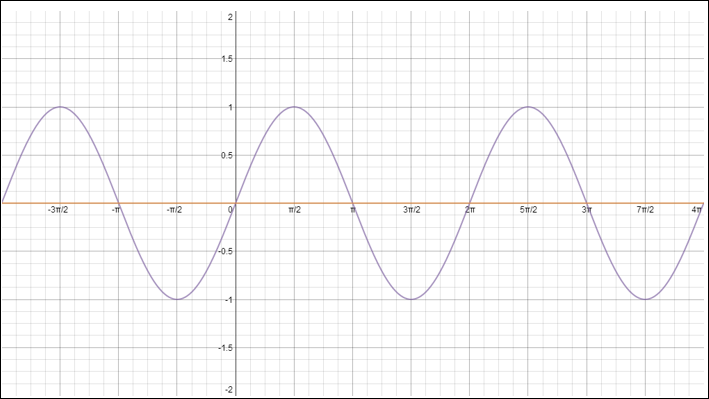 |
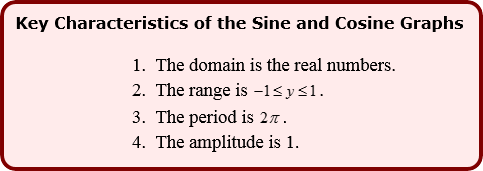
The sine function has a period of 2π because the sine wave repeats every 2π units. The maximum value of the function is 1 and the minimum value of the function is –1. The midline of a function is the horizontal line midway between the maximum and minimum values of a function. For y = sin θ, the midline is the line y = 0 (the horizontal axis). The amplitude of a function is half the difference between the maximum and minimum values. The amplitude for the function y = sin θ is 1. Notice that the sine function has a value of 0 whenever θ is a multiple of π. Thus sin 0, sin π, sin 2π, sin 3π…, all have values of 0.
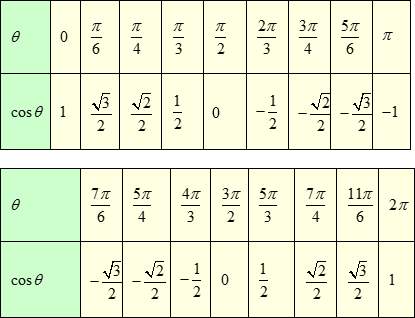
The graph of the cosine function is drawn in a similar manner as the sine function. The table below shows the values of the cosine function for the critical values of θ where 0 ≤ θ ≤ 2π.
 |
If all the values in the table are graphed, the following standard graph of the cosine is obtained:
 |
The cosine graph looks very similar to the sine graph. It has the same domain, range, and period. If you shift the cosine graph
 |
To graph these functions on a graphing calculator using radians, set the mode to radians. Type in the following parameters:
Xmin = –2π |
Press the y = key and type in the function that you would like to graph, that is y = sin x or y = cos x.
To graph these functions on a graphing calculator using degrees, set the mode to degrees. Type in the following parameters:
Xmin = –360 |
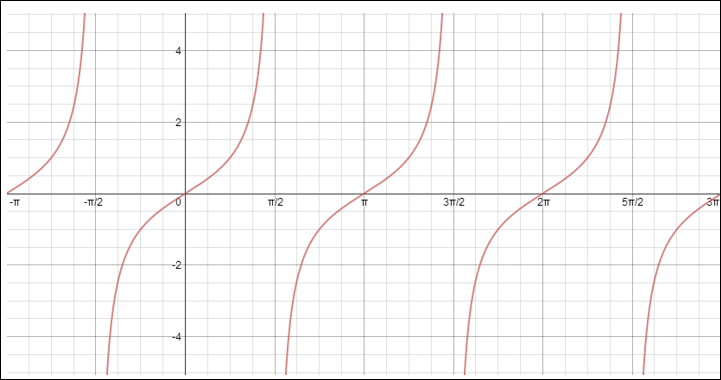
The graph of the tangent function can also be drawn by plotting points. The table below shows the values of the tangent function for the critical values of θ where 0 ≤ θ ≤ 2π.
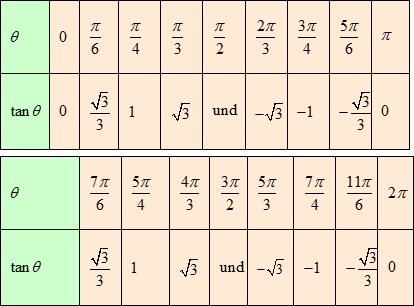 |
Notice there are values for θ at which the tangent function is undefined. The graph has vertical asymptotes at these values. An asymptote is an imaginary line that a graph approaches but never touches. Notice that the tangent graph will have an asymptote at all the half values of π, such as ![]() ,
, ![]() and
and ![]() etc. The function crosses the x-axis at zero, half way between the asymptotes. So the tangent function will cross the x-axis whenever θ is a multiple of π. Thus tan 0, tan π, tan 2π, tan 3π…, all have values of 0. Since the graph repeats itself every π radians, the period of the tangent function is π. The tangent function has no altitude since it has no maximum or minimum values.
etc. The function crosses the x-axis at zero, half way between the asymptotes. So the tangent function will cross the x-axis whenever θ is a multiple of π. Thus tan 0, tan π, tan 2π, tan 3π…, all have values of 0. Since the graph repeats itself every π radians, the period of the tangent function is π. The tangent function has no altitude since it has no maximum or minimum values.
 |
 |
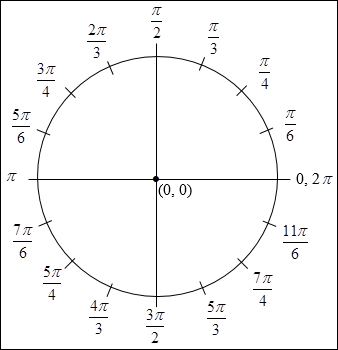
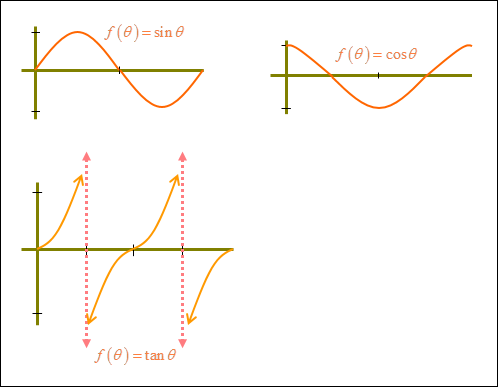
The following diagrams serve as the characteristic curves for our graphs for all angles from 0 to 2π (0 to 360).
 |
Stop! Go to Questions #1-8 about this section, then return to continue on to the next section.
Variations of Trigonometric Functions
Just as with other functions, changes to the equation of the parent graph can affect the appearance of the graph. We will examine changes to the amplitude and the period of the characteristic graphs of the sine and cosine graphs by investigating the graphs of y = Asin(Bx) and y = Acos(Bx).
Amplitude (A)
The value A affects the amplitude. This value determines the maximum and minimum vertical values of the function. In the characteristic curve y = sin θ, the amplitude is, A = 1.With your calculator’s window settings still set for the values used to find the characteristic curves in the first part of this unit, enter the following equation into
| (Y1 = sin x is shown in red,Y2 = 3sin x is shown in blue, and Y3 = 0.5 sin x is shown in green) |
| Note: Be sure your calculator is set for “Radian” mode as well. |
|
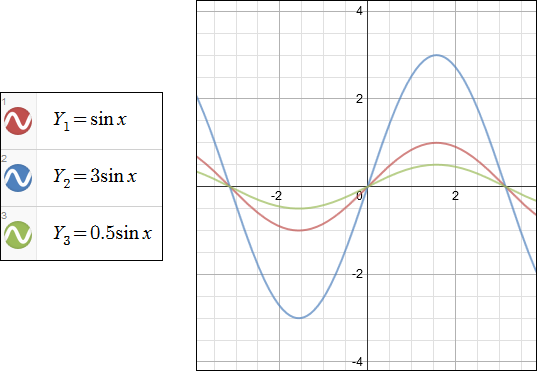
The first curve to be graphed was the characteristic curve for y = sin θ. The second curve for y = 3sin θ is off the screen vertically because, with an amplitude of “3”, it reaches its y-maximum and y-minimum values of 3 and –3 beyond the calculator’s window settings for Ymin and Ymax. (To see this entire curve, you may want to adjust these settings accordingly). The third curve graph reaches a maximum and minimum value of
 and
and  respectively. An important feature for all curves is that they all reach their maximum and minimum values at θ =
 When A is negative, the graph is a reflection across the x-axis ( y = sin θ is shown in red and y = –sin θ is shown in blue).
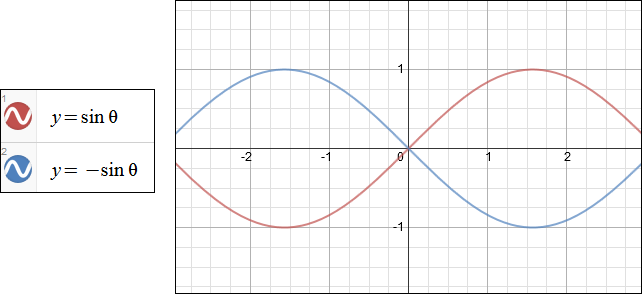 |
The amplitude of both of these functions is 1, since amplitude is |A|.
In the function y = Acos θ, the amplitude works in a manner similar to the function y = Asin θ. The tangent function does not have an amplitude because it has no maximum or minimum value. In the function y = Atan θ, changes in A effect the steepness of the graph.
Frequency and Period
The next component of the standard equation is the value of “B” the “Frequency” and the “Period” which isType the following equations into your calculator and view each graph.
| (Y1 = cos x is shown in red and Y2 = cos 2x is shown in blue) |
|
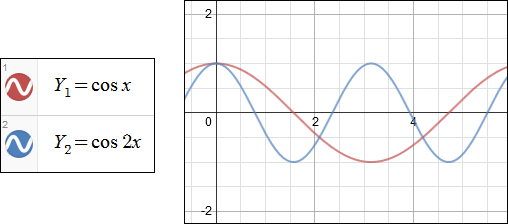
When Y2 is graphed, two complete cosine curves appear between 0 and 2π. For Y2 = cos(2x), the value of B = 2. So it cycles 2 times from 0 to 2π. The period of the function is
If you type a third equation into Y3 such as: Y3 = cos(0.5x) and view its graph, only the first half of the cosine’s characteristic curve will appear. The value of B = 0.5. Therefore, the value of “B”-the frequency- determines how many characteristic curves will appear in a standard viewing window from 0 to 2π. The period of the function Y = cos(0.5x) can be found be substituting 0.5 for B in the expression
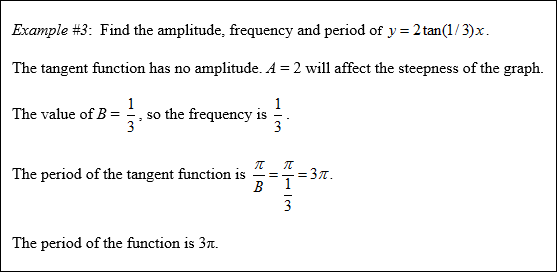
For the function y = Atan(Bx), the frequency is B. The period is
 |
 |
 |
Stop! Go to Questions #9-17 to complete this unit.
The Pythagorean Identity
An identity is any equation that is true for every number in the domain of the equation. An identity involving trigonometric expressions is called a trigonometric identity. An important trigonometric identity is the Pythagorean Identity. The Pythagorean Identity can be verified using the unit circle and the Pythagorean Theorem.
Remember from the previous unit that a right triangle can be inscribed in the circle in the following manner. For an angle in standard position, the terminal side of an angle in the unit circle hits at a point whose x-coordinate is the angle’s cosine and whose y-coordinate is the angle’s sine, that is cos θ = x and sin θ = y.
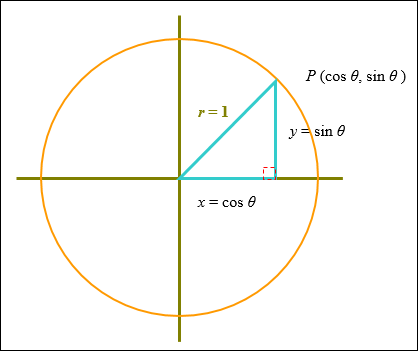 |
The equation of a unit circle is x2 + y2 = 1.
| x2 + y2 = 1 | |
| (cos θ)2 + (sin θ)2 = 1. | Substitute x = cos θ and y = sin θ |
| cos2θ + sin2θ = 1 | Rewrite in this form without parentheses |
The Pythagorean identity is cos2θ + sin2θ = 1.
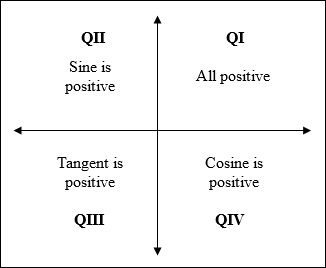
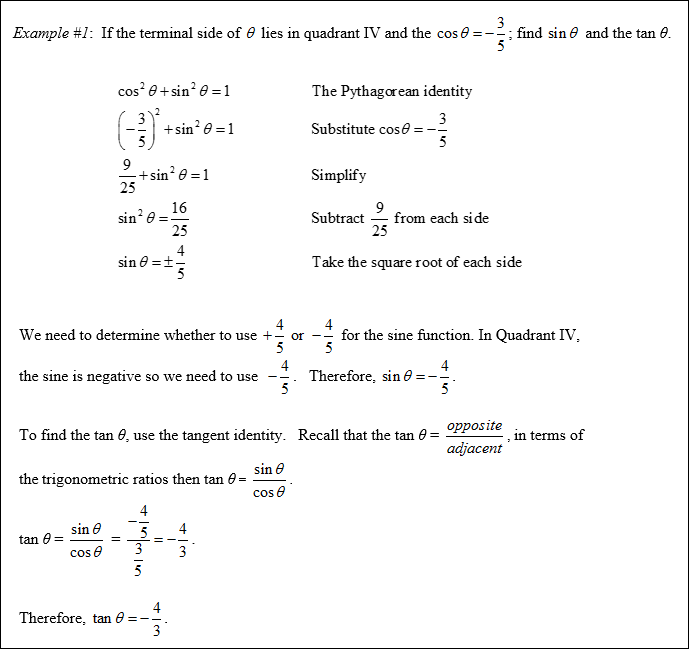
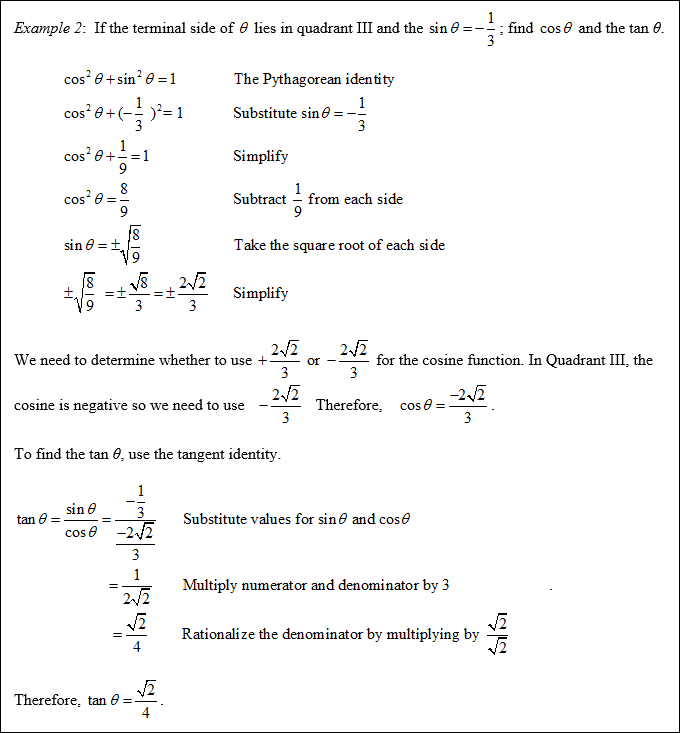
*If given a quadrant that contains the terminal side of θ and the exact value of one trigonometric function, you can use the Pythagorean identity to find the values of the other trig functions. Keep in mind that the signs of the trig functions are different in each quadrant. Study the illustration below.
 |
 |
 |
Stop! Go to Questions #18-28 to complete this unit.