SYSTEMS OF EQUATIONS AND LINEAR EQUALITIES
A system of equations is a collection of equations in the same variables. In this unit you will solve systems of equations using 3 techniques; graphing, substitution, and elimination. At the conclusion of the unit, you will be graphing linear inequalities.
Graphing Systems of Equations
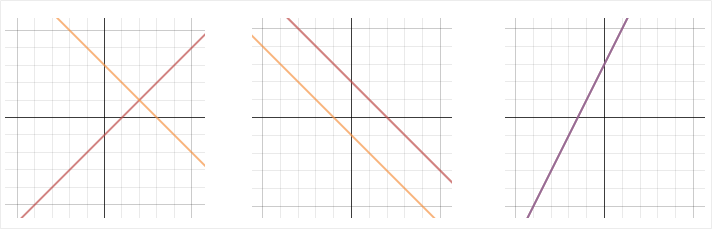
The solution of a system of two linear equations in x and y is any ordered pair, (x, y) that satisfies both equations. The solution (x, y) is also the point of intersection of the graphs.
There are 3 possible solutions. 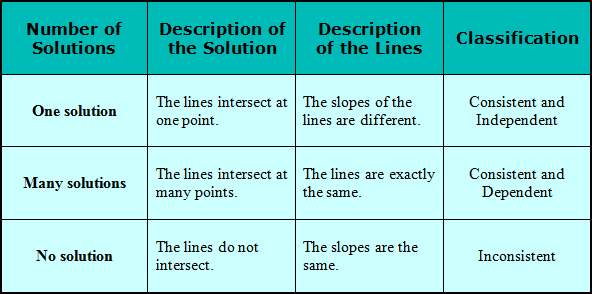 |
To graph a line, remember to solve for y and use the slope intercept form of y = mx + b. Plot the y-intercept, use the slope ratio of ![]() to plot more points, and then connect the points using a straight edge.
to plot more points, and then connect the points using a straight edge.
 |
![]() Graphing Systems of Equations -- Freediving (02:59)
Graphing Systems of Equations -- Freediving (02:59)
Let's review consistent and inconsistent systems.
![]() What is the classification of this system shown below?
What is the classification of this system shown below?
The system is inconsistent.
"Click here" to check the answer.
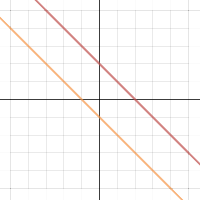 |
![]() How many solutions does this system have?
How many solutions does this system have?
There are no solutions.
"Click here" to check the answer.
![]() What is the classification of this system shown below?
What is the classification of this system shown below?
The system is consistent and independent.
"Click here" to check the answer.
 |
![]() How many solutions are there?
How many solutions are there?
There is one solution.
"Click here" to check the answer.
![]() What is the classification of the system shown below?
What is the classification of the system shown below?
Note: The graph shows two lines, one coinciding with the other; thus, one lies atop the other?
The system is consistent and dependent.
"Click here" to check the answer.
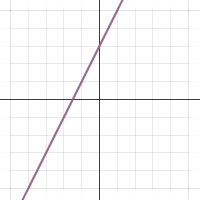 |
![]() How many solutions are there?
How many solutions are there?
There are many solutions.
"Click here" to check the answer.
Stop! Go to Questions #1-5 about this section, then return to continue on to the next section.
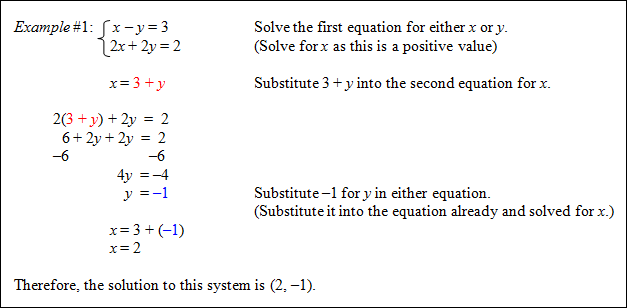
Substitution Method for Solving Systems of Equations
To solve a system by substitution:
1.) solve one of the equations for a variable (hint: solve for a variable that has a coefficient of 1
2.) substitute this value into the other equation to find the value of one of the variables
3.) substitute this value back into either of the equations to find the second variable
 |
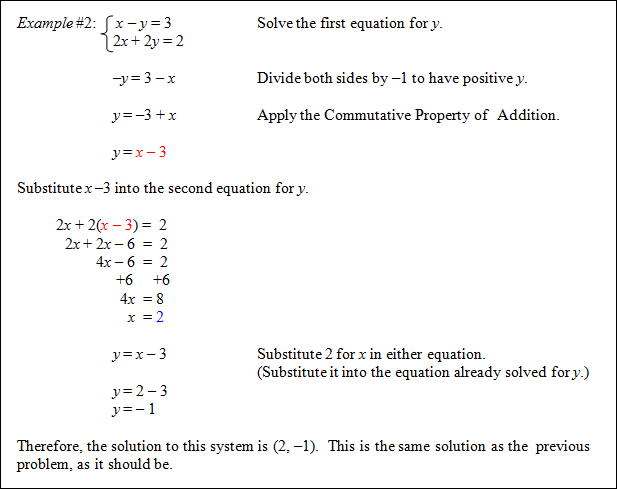
Let's take a look at this problem again, but this time, solve the first equation for y.
 |
![]() Solving Systems of Equations with Substitution (04:24)
Solving Systems of Equations with Substitution (04:24)
Stop! Go to Questions #6-8 about this section, then return to continue on to the next section.
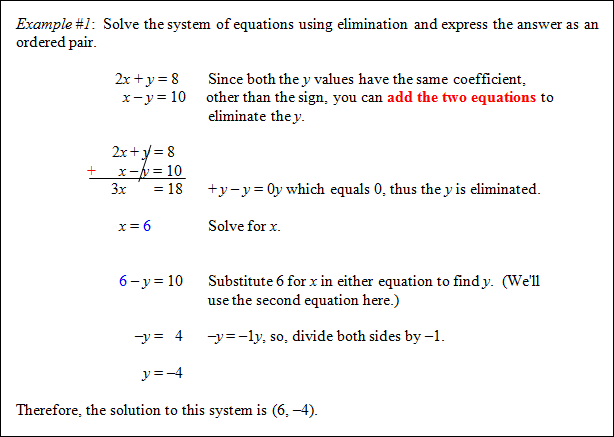
To solve a system by elimination:
1.) the coefficients of the same variable must be the same |
![]() Solving Systems of Equations: Two Approaches (02:59)
Solving Systems of Equations: Two Approaches (02:59)
 |
![]() Elimination and the Addition Property (04:33)
Elimination and the Addition Property (04:33)
 |
![]() Elimination and the Multiplication Property of Equality (04:06)
Elimination and the Multiplication Property of Equality (04:06)
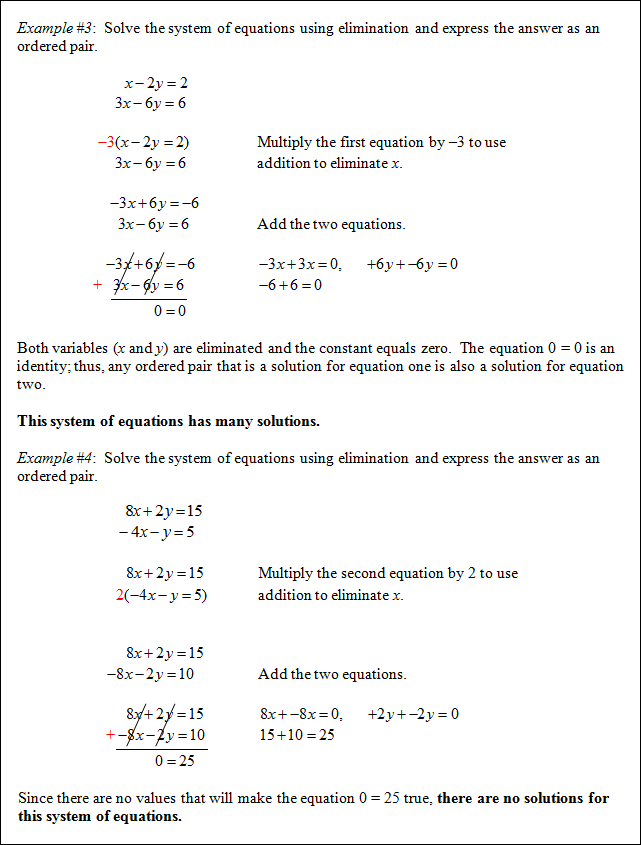 |
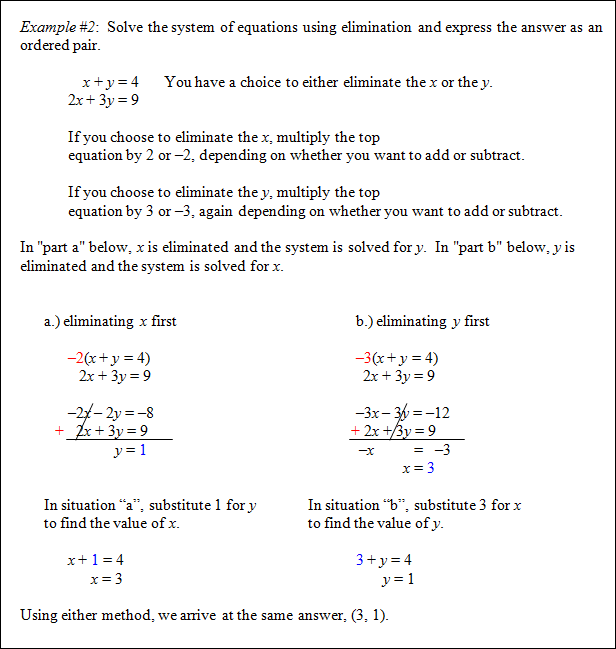
Sometimes it is necessary to multiply both equations in a system to eliminate one of the variables. Multiply each equation by values so that one of the variables has the same or opposite coefficient in both equations.
Let's see how this works.
 |
Stop! Go to Questions #9-13 about this section, then return to continue on to the next section.
Applications of Linear Systems
|

![]() Systems of Equations and Algebra -- Scubadiving (02:56)
Systems of Equations and Algebra -- Scubadiving (02:56)
 |
![]() Word Problem: Rate, Time, and Distance (04:12)
Word Problem: Rate, Time, and Distance (04:12)
Systems of equations are used in business to determine the break-even point. The break-even point is the point at which income equals the cost.
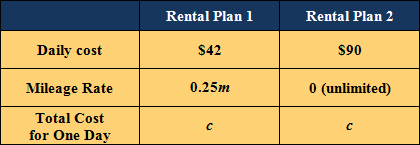
 Example #4: The Jones family plans to rent a car for a one-day trip. The car rental company offers two rental plans. The first plan allows them to rent a car for $42 per day plus 25 cents per mile. The second plan allows them to rent a car for $90 a day with unlimited mileage. Write an equation that represents the cost of renting each car. Find the break-even point of the rental cars. If the Jones family plans to drive 150 miles, which plan should they choose? Example #4: The Jones family plans to rent a car for a one-day trip. The car rental company offers two rental plans. The first plan allows them to rent a car for $42 per day plus 25 cents per mile. The second plan allows them to rent a car for $90 a day with unlimited mileage. Write an equation that represents the cost of renting each car. Find the break-even point of the rental cars. If the Jones family plans to drive 150 miles, which plan should they choose?Let m = the number of miles the car is driven c = the total cost to rent the car for one day
Since the first plan costs $42 plus 25 cents per mile, the first equation is: c = 42 + 0.25m Since the second plan costs $90 a day with unlimited mileage, the second equation is: c = 90 Write and solve the system of equations. Since both equations represent c, use substitution to solve the system. Thus, the cost for the rental plans is the same if they plan to drive 192 miles. This is the break-even point. If the Jones family plans to drive less than 192 miles the first plan is cheaper. If the Jones family plans to drive more than 192 miles the second plan is cheaper. |
![]() Which plan is cheaper for the Jones family outing?
Which plan is cheaper for the Jones family outing?
Rental Plan 1 is cheaper since they are only traveling 150 miles.
"Click here" to check the answer.
Stop! Go to Questions #14-17 about this section, then return to continue on to the next section.
Linear Inequalities
A solution to a linear inequality in two variables, x and y, is an ordered pair (x, y) that satisfies the inequality. The solution to a linear inequality is a region of the coordinate plain and is called a half-plane bounded by a boundary line.
*If a linear inequality is a < or > , the boundary line will be a dashed line. ----------
*If a linear inequality is a ≤ or ≥ , the boundary line will be a solid line. _______
| 1.) solve the inequality for y 2.) plot the y-intercept 3.) use the slope 4.) determine whether to connect with a dashed line or a solid line 5.) shade a region of the coordinate plane (this is determined by either < , > , ≤ , or ≥ ). If < or ≤ , shade below the boundary line; if > or ≥ , shade above the boundary line. |
You can also choose a point to test, such as (0, 0), as it is easy to test if it does not lie on the line. If you plug 0 in for x and y and get a true statement, shade the portion of the coordinate plane that contains that point. If you plug 0 in for x and y and get a false statement, shade the portion of the coordinate plane that does not contain that point. If the point (0, 0) is on the line, choose another point as the test point.
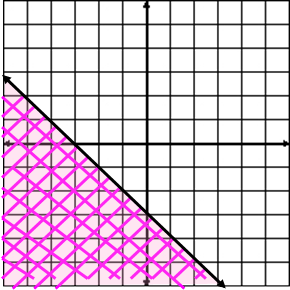
Example #1: y ≤ –x – 3 Since this is a ≤ inequality, the line is solid. To test the point (0, 0), replace x and y with 0. Since we chose to shade the region that does not include (0, 0), we should get a false 0 ≤ –(0) – 3 This is a false statement; therefore, we chose |
|
Example #2: y > 2x – 2 Since this is > , the boundary line will be dashed. To test the point (0, 0), replace x and y with 0. 0 > 2(0) – 2 This is a true statement; therefore, we chose |
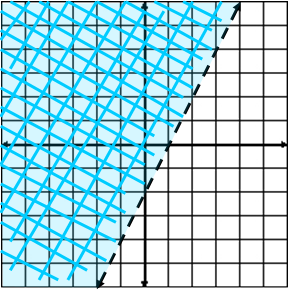 |
Stop! Go to Questions #18-25 to complete this unit.