SPECIAL FUNCTIONS AND TRANSFORMATIONS
 |
Unit Overview
Some real-world relationships can be modeled with special functions. For example, the dosage of medicine given to a child can be modeled with a step-function. This unit will look at “special” functions − piecewise, step and absolute-value functions. The unit concludes with an overview of basic transformations of the graphs of functions.
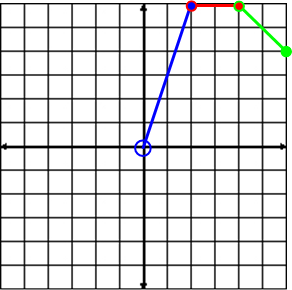
Special Functions
Piecewise Functions
| piecewise function: consists of different function rules for different parts of the domain. |
To graph:
1.) make a table of values for each domain
2.) substitute values into each given equation
3.) plot points
4.) decide whether to use open points (< or >) or closed points (≤, ≥); and whether or not to use a line segment or a continuous ray, and then connect the points.
After establishing the domain in each of the functions, find the y values by replacing x with each of the domain and solve for y. |
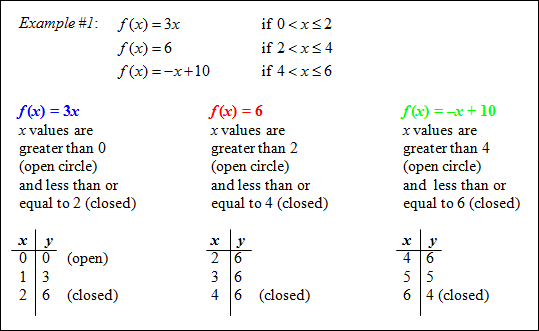
Graph each function separately.
 |
Step Functions
A piecewise function where the graph looks like a set of steps is called a step function.
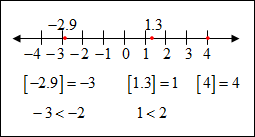
A step function pairs every number in an interval with a single value. *Recall that that the set of integers are: {... −3, −2, −1, 0, 1, 2, 3 ...}. The greatest-integer function f (x) = [x] is a step function where [x] represents the greatest integer less than or equal to x. This does not mean to round on truncate the number. For example, [7.8] = 7 because 7 is the greatest integer less than 7.8. Similarly, [−2.9] = −3 because −3 is the greatest integer less than −2.9. *Note the answer to [−2.9] ≠ −2 since −2 is not less than −2.9. Also, [4] = 4, since 4 is the integer equal to 4.
**The greatest integer value will be the first integer to the left of the given decimal value on the number line. |
![]() What is the value of [12.6]?
What is the value of [12.6]?
12 because 12 is the greatest integer less than 12.7
"Click here" to check the answer.
![]() What is the value of [0.5]?
What is the value of [0.5]?
0 because 0 is the greatest integer less than 0.5
"Click here" to check the answer.
![]() What is the value of [−0.3]?
What is the value of [−0.3]?
−1 because −1 is the greatest integer less than −0.3
"Click here" to check the answer.
*Note: The first integer to the left of −0.3 on the number line is −1
.
![]() What is the value of [−4.2]?
What is the value of [−4.2]?
5 because −5 is the greatest integer less than −4.2
"Click here" to check the answer.
*Note: The first integer to the left of −4.2 on the number line is −5.
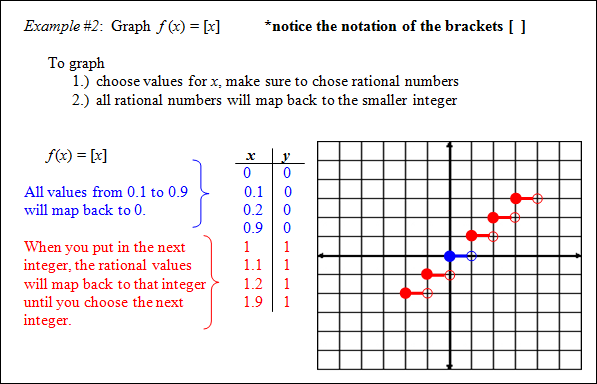 |
Each piece of the graph is a horizontal line segment that is missing the right endpoint. The open circle shows that the right endpoint is not part of the graph.
Let's take a look at how a step function can be applied.
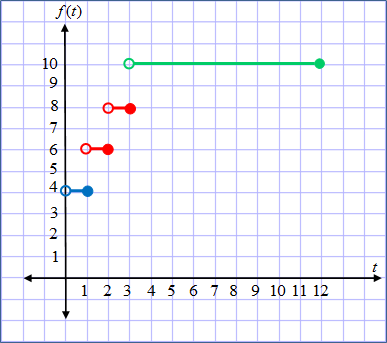
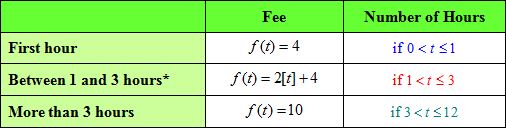
Example #3: A downtown parking garage charges $4 for the first hour. The charge is $2 for each additional hour or part of an hour. The maximum charge to park in the garage is $10. The maximum time to leave the car in the garage is 12 hours. (a) Write a function and graph the step function that shows the fee ( f ) in terms of the number of hours (t). A table can be useful to organize the given information.
*During the hours between 1 and 3, the fee is based on usage of an hour or part of an hour; thus, we use the integer function. The graph is a step function because each hour is paired in intervals with a single fee. *Notice on this graph the open circle is on the left of the line segment and the closed circle is on the right. (b) Use the graph to find the cost of parking in the garage for 2 1 ⁄ 2 hours.
The cost for 2 1 ⁄ 2 hours is $8. "Click here" to check the answer.
The domain is 0 < t ≤ 12 hours. "Click here" to check the answer.
The range is {4, 6, 8, 10}. "Click here" to check the answer.
The range is {4, 6, 8, 10} as these are the only different fees that can be charged. |
The graphs of step functions are often used to model real-world problems such as fees for cell phones, postage rates and taxes.
Absolute Value Functions
The absolute value function is another piecewise function.
The simplest example of an absolute value function is f (x) = | x |.
*Recall that absolute value is the positive value of the number or expression within the bars.
To graph the absolute value function, make a table of values, and then graph.
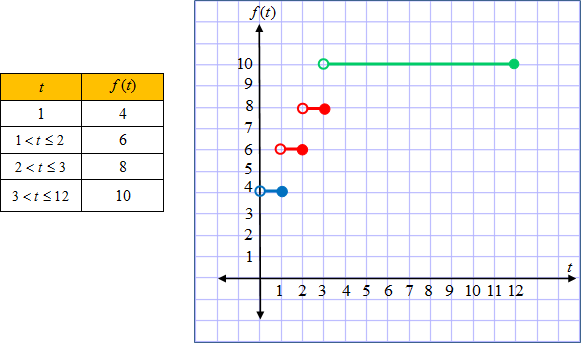
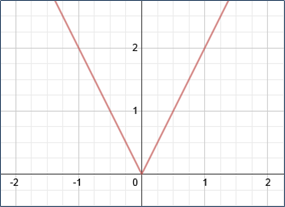
Graph of y = | x |
|
The graph of an absolute value function is V-shaped and symmetric about a vertical line called the axis of symmetry. The graph has either a maximum point (highest) or a minimum (lowest) point called the vertex.
For f (x) = | x | the vertex is the point (0, 0). It is a minimum point since it is the lowest point on the graph. The axis of symmetry is the line x = 0, the y-axis. The axis of symmetry divides the graph into two mirror images.
The domain of f (x) = | x | is all real numbers.
The range of f (x) = | x | is y ≥ 0 (in other words, zero and all positive numbers).
Stop! Go to Questions #1-5 about this section, then return to continue on to the next section.
Transformations of Absolute Value Functions
| A transformation of a function is an alteration of the function that results in an alteration of its graph. The original graph is referred to as the “parent function”. |
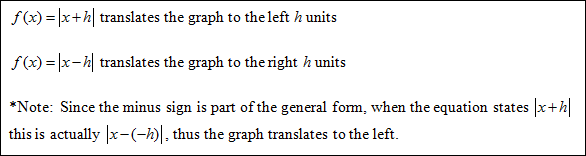
Horizontal Transformations
|
![]() How will f (x) = | x − 7 | be transformed from the parent function f (x) = | x |?
How will f (x) = | x − 7 | be transformed from the parent function f (x) = | x |?
The function will be moved 7 units to the right.
"Click here" to check the answer.
![]() How will f (x) = | x + 5 | be transformed from the parent function f (x) = | x |?
How will f (x) = | x + 5 | be transformed from the parent function f (x) = | x |?
The function will be moved 5 units to the left.
"Click here" to check the answer.
*Note: In both previous questions, the constant is contained with the variable; thus, each one transforms horizontally in the opposite direction of the sign.
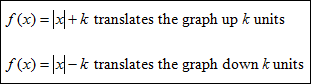
Vertical Transformations
![]() How will f (x) = | x | + 2 be transformed from the parent function f (x) = | x |?
How will f (x) = | x | + 2 be transformed from the parent function f (x) = | x |?
The function will be moved up 2 units.
"Click here" to check the answer.
![]() How will f (x) = | x | − 10 be transformed from the parent function f (x) = | x |?
How will f (x) = | x | − 10 be transformed from the parent function f (x) = | x |?
The function will be moved down 10 units.
"Click here" to check the answer.
Vertical and Horizontal Transformations
![]() How will f (x) = | x − 7 | + 12 be transformed from the parent function f (x) = | x | ?
How will f (x) = | x − 7 | + 12 be transformed from the parent function f (x) = | x | ?
The function is translated 7 units to the right and 12 units up.
"Click here" to check the answer.
![]() What is the axis of symmetry of f (x) = | x − 7 | + 12 ?
What is the axis of symmetry of f (x) = | x − 7 | + 12 ?
x = 7
"Click here" to check the answer.
![]() What is the vertex of f (x) = | x − 7 | + 12 ?
What is the vertex of f (x) = | x − 7 | + 12 ?
vertex = (7, 12)
"Click here" to check the answer.
*The axis of symmetry (x = 7) is the vertical line that divides the graph into two mirror images. The vertex (7, 12) is the lowest point of the graph.
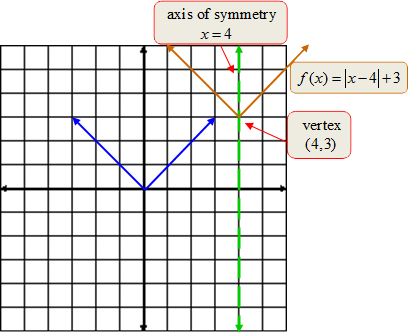
Example #1: For the function, f (x) = | x − 4 | + 3 describe the transformation in terms of the parent graph f (x) = | x |. State the vertex and the axis of symmetry.
|
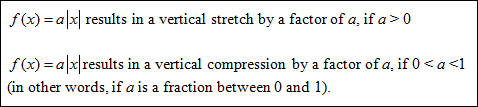
Vertical Stretch and Compression
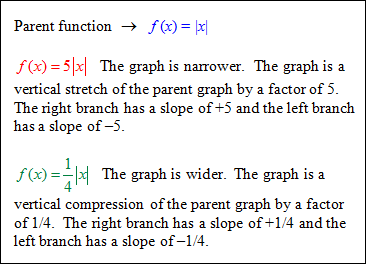
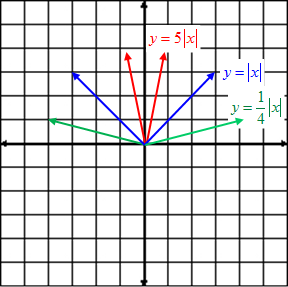
In the graph of f (x) = | x |, the right branch has a slope of +1 and the left branch has a slope of −1.
The graph of f (x) = a | x | is a stretch or compression of the graph of f (x) = | x |. The right branch has a slope of a and the left branch has a slope of −a.
|
Example #2: Describe the graph of f (x) = 2 | x | as it relates to the parent function f (x) = | x |.
|
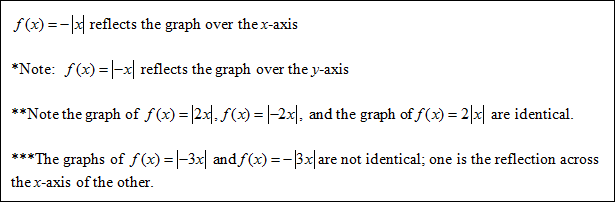
Reflection |
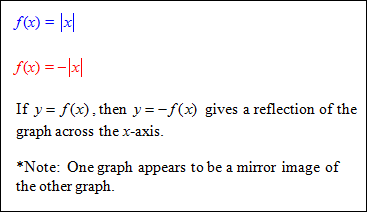
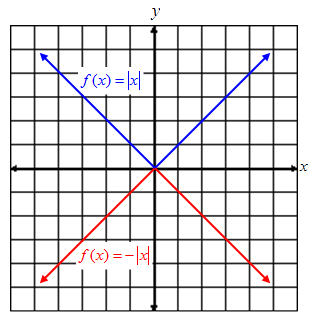
Example #3: Describe the graph of
|
Summary of Absolute Value Transformations
The general form of an absolute value function is:
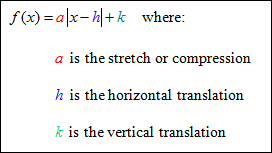 |
The transformations that occur on the parent function f (x) = | x | are:
(1) Horizontal Translation
(2) Vertical Translation
(3) Vertical Stretch and Compression
(4) Reflection
|
Stop! Go to Questions #6-30 to complete this unit.