PDF File
MAKING PREDICTIONS WITH DATA AND EXAMINING RATE OF CHANGE
We use tables and charts to organize and summarize data, and make predictions based on data. We use graphs to give us a visual clue to help with making predictions. For example, a line graph shows data that changes over time.
Making Predictions Based on Data
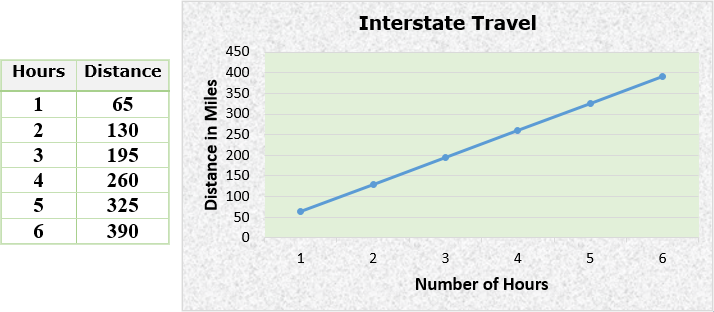
On the interstate highway, a car is permitted to travel 65 MPH. Below is a chart that graphs the number of miles a car averages per hour.
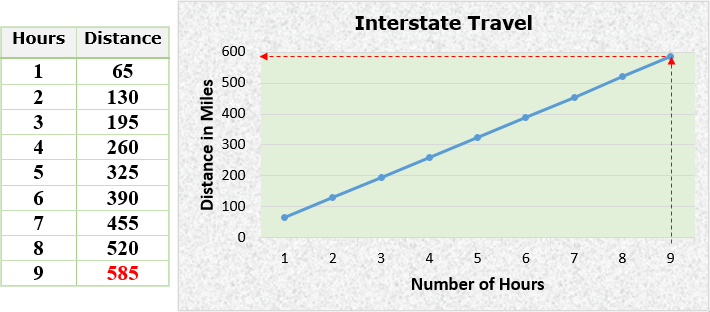
Predict how many miles the car will travel after 9 hours.
Possible Solutions:
1. Find the pattern in the table and extend it out to 9 hours.
2. Extend the graph out and estimate.
|
Rate of Change
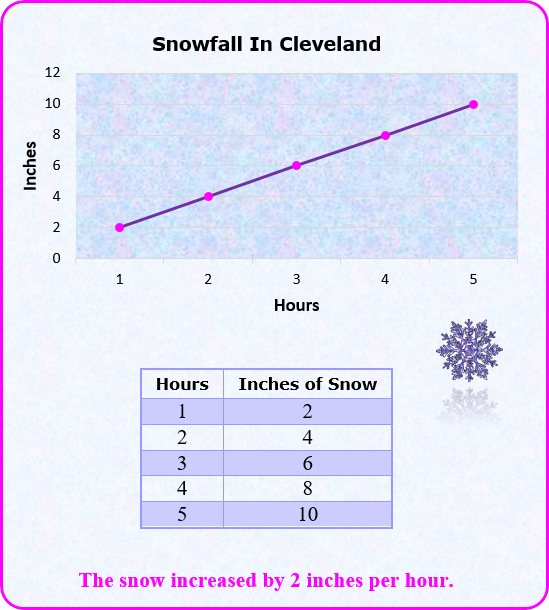
Snow fell in Cleveland at a steady rate for five hours. Study the graph below. Make a table to look for a pattern in the data presented. State how much snow fell per hour.
|