Linear Inequalities and Properties of Graphing Linear
Inequalities
Linear Inequalities
Section Overview
1. Graph inequalities on a
number line.
2. Use the addition property of inequality to solve inequalities.
3. Use the multiplication property of inequality to solve inequalities.
4. Use both properties to solve inequalities.
5. Solve problems modeled by inequalities.
6. Key Vocabulary: inequality, <, ≤, >, ≥,
addition property of inequality, multiplication property of inequality, at
least, no less than, at most, no more than, is less than, is greater than.
Key Vocabulary:
Inequality - A mathematical sentence that compares
expressions. It contains the symbol <, >, _<, >_.
Solution of an
Inequality - A value that makes
the inequality true.
Solution Set - The set of all solutions of an inequality.
Graph of an
Inequality - Shows all of the
solutions of the inequality in a number line.
Compound Inequality - An inequality formed by joining two inequalities
with the word "and" or the word "or."
Absolute Value
Inequality - An inequality
that contains an absolute value expression.
Solution of a Linear
Inequality - Where two
variables are an ordered pair (x, y) that makes the inequality
true.
Graph of a Linear
Inequality - Two variables shows all of the solutions of the inequality on a coordinate
plane.
An inequality is like an equation, but instead
of an equal sign (=) it has one of these signs:
< less than
≤ less than or equal to
> greater than
≥ greater than or equal to
1) Place an
open dot on 9. Decide if the dot should be colored in (if equal Is part of the
symbol). Then, draw a line and arrow to the right.
The values that lie on the line make the sentence
true, as all numbers are greater than 9.
 |
1) Place an open dot
on 10. Decide if the dot should be colored in (if equal is part of the symbol).
Then, draw a line and arrow to the left.
The values that lie on the line make the sentence true, as all numbers are less
than or equal to 10.
 |
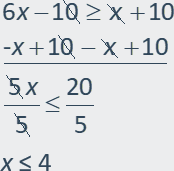
Example 1: Solve the inequality 2(3x 5) ≤ x + 10.
First, distribute the 2 on the
left side of the inequality.
2(3x 5) ≤ x + 10
6x 10 ≤ x + 10
Now, subtract the x on
the right side to move it to the left side of the inequality. You can also add
the 10s together and solve.
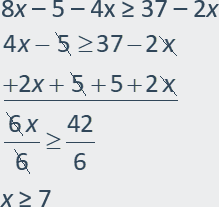
Example 2: Solve the inequality 8x 5 4x ≥ 37 2x.
First, combine like terms on the left side. Then, solve for x.
Find all numbers x such
that -3 < 5 2x and 5 2x < 9.
-3 < 5 2x 5 2x < 9
-8 < -2x -2x < 4
4 > x x >
-2
(-inf, 4) (-2, inf)
In order to satisfy both
inequalities, a number must be in both solution sets. So, the numbers that
satisfy both inequalities are the values in the intersection of the two
solution sets, which is the set (-2, 4) in interval notation.
The problem above is usually written as a double inequality.
-3 < 5 2x < 9 stands for -3 < 5 2x and 5 2x
< 9.
Note: When we solved the two inequalities separately, the steps in the
two problems were the same. Therefore, the double inequality notation may be
used to sole the inequalities simultaneously.
-3 < 5 2x < 9
-8 < -2x < 4
4 > x > -2
In terms of graphs, this problem corresponds to finding the values of x
such that the corresponding point on the graph of y = 5 2x is
between the graphs of y = -3 and y = 9.
Example 3: Find all numbers x such that x + 1
< 0 or x + 1 > 3.
In the previous
example, we were looking for numbers that satisfied both inequalities. Here we
want to find the numbers that satisfy either of the inequalities. This
corresponds to a union of solution sets instead of an intersection.
Do not use the double inequality notation in this situation.
x + 1 < 0 x
+ 1 > 3
x < -1 OR x > 2
(-inf, -1) (2, inf)
Lets Practice
Multi-Step
Inequalities Practice | CK-12 Foundation (ck12.org)
Properties of Graphing Linear
Inequalities
Given the graph of a related equation, determine the
solution region to an inequality in two variables by testing the points on the
line and on either side of the line.
Understand that the solutions to a linear inequality in two variables are
represented graphically as a half-plane bounded by a line.
Key Vocabulary:
Definition - Replacing the equals sign in
a linear equation with an inequality symbol makes a linear inequality in
two variables.
Main Idea - A linear inequality in two variables has an infinite number
of solutions, each an ordered pair that makes the inequality try.
Example: y ≥ 2x 9 is a linear inequality in two
variables.
Example 1: Graph the inequality y ≤ 4x 2.
This line is already in slope-intercept form, with y alone on the
left side. Its slope is 4 and y-intercept is -2. So, its
straightforward to graph it. In this case, we make a solid line since we
have a less than or equal to inequality.
 |
Now, substitute x = 0, y
= 0 to decide whether (0, 0) satisfies the inequality.
0 ≤ 4 (0) 2
0 ≤ 2
This is false. So, shade the
half-plane which does not include point (0, 0).
 |
Example 2: Graph the inequality 2y − x ≤ 6.
1. We will need to rearrange
this one so "y" is on its own on the left:
Start with: 2y − x
≤ 6
Add x to both sides: 2y ≤ x + 6
Divide all by 2: y ≤ x/2 + 3
2. Now plot y = x/2
+ 3 (as a solid line because y ≤ includes equal to):
 |
3. Shade the area below
(because y is less than or equal to):
 |
Lets Practice.