Measures
of Variation
Unit Objective
●
Find and interpret the range and interquartile range of a data
set.
Key
Vocabulary
A measure of variation is a measure that describes the distribution of a data set. A simple
measure of variation to find is the range. The range of data set is the difference of
the greatest value and the least value.
Quartiles
divide the data Into four equal parts.
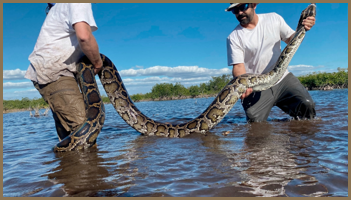
Finding the Range
The table shows the lengths of several Burmese pythons captured
for a study. Find and interpret the range of the lengths.
 |
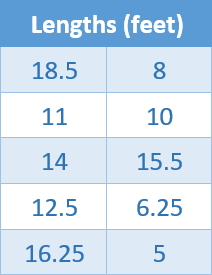 |
To find the least and greatest values, order the lengths from least to greatest.
5,
6.25, 8, 10, 11, 12.5, 14, 15.5, 16.25, 18.5
The least value is 5. The greatest value is 18.5.
So, the range of the lengths is 18.5 – 5 = 13.5 feet. This means
that the lengths vary by no more than 13.5 feet.
Let's Practice.
The ages of people on a roller coaster are 15, 17,
21, 32, 41, 30, 25, 52, 16, 39, 11, and 24. Find and interpret the range of the
ages.
 |
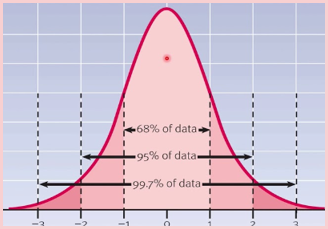
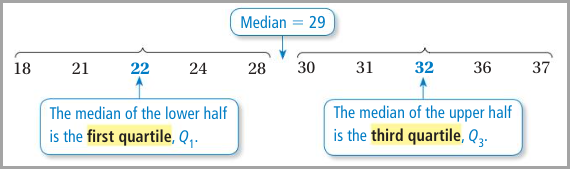
Quartiles
The quartiles
of a data set divide the data into four equal parts. Recall that the median (second
quartile) divides the data set into two halves.
 |
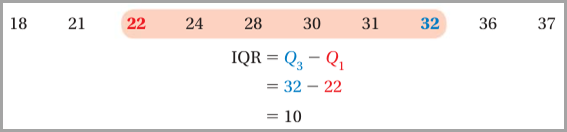
Interquartile Range (IQR)
The
difference of the third quartile and the first is called the interquartile
range. The IQR represents the range of the middle half of the data and is
another measure of variation.
 |
Let's practice.
The
data are the number of pages in each of an author's novels. Find the
interquartile range of the data.
356, 364, 390, 468, 400, 382, 376, 396, 350.
 |
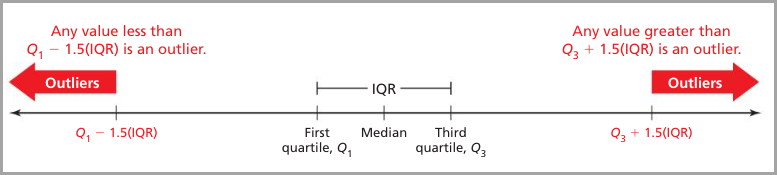
Identifying Outliers
You
can use the quartiles and the interquartile range to check for outliers.
 |
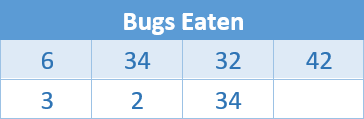
Modeling Real Life
The
table shown below identifies 2 as an outlier of the data. Use the IQR to
determine whether it is the only outlier.
 |
Order
the data values from least to greatest. Find the quartiles.
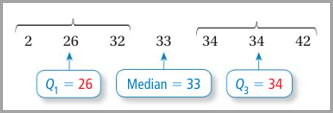 |
The
IQR is 34 – 26 = 8. Use the IQR to find the outlier boundaries.
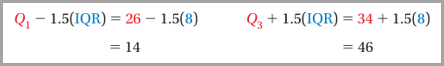 |
The only data value less than 14 is 2. There
are no data values greater than 46. So, the only outlier is 2.
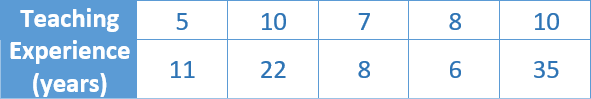
Let’s practice.
The
table shows the years of teaching experience of math teachers at a school. How
do the outlier or outliers affect the variability of the data?
 |
 |