Statistical
Mean
Unit Objective
●
Find and interpret the mean of a data set.
Key Vocabulary
●
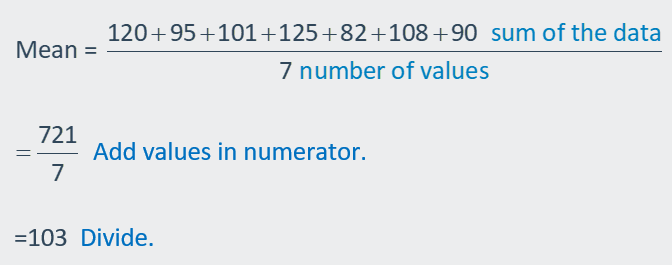
The mean of a data set is the sum of the data set divided by the
number of data values (It is a type of average).
●
Outlier - An outlier is a value that is
much higher or lower than the other values in a data set. When calculating the
mean of a data set with an outlier, the outlier can significantly affect the
value of the mean.
Let's Practice.
The
hens weigh 7, 8, and 9 pounds. What is the mean weight of the three hens?

 |
Finding The Mean
To calculate the mean, also known
as the average, you can follow these steps:
| 1. Add
up all the values you want to find the mean of.
2. Count the number of values you added up. 3. Divide the sum by the count. |
The formula for the mean is:
For example, suppose you have the following set of values: 4, 5,
7, 3, and 9. To find the mean:
| 1.
Add
up all the values: 4 + 5 + 7 + 3 + 9 = 28. 2. Count the number of values: There are 5 values. 3. Divide the sum by the count: 28 / 5 = 5.6. |
Therefore, the
mean of the set of values is 5.6.
Example 1: The table shows the
numbers of text messages sent by a group of friends over 1 week. What is the
mean number of messages sent?
 |
|

Let's practice.
Find
the mean of the data.
 |
 |
 |
Comparing Means
The double bar graph shows the monthly rainfall
amounts for two cities over a six-month period. Compare the mean monthly
rainfalls.
 |
 |
Because 2.6 is greater than 2, City A averaged more
rainfall.
Let's practice.
Ed
scored 26, 34, 16 and 19 points in 4 basketball games and Charlie scored 6, 14,
22, and 16 in 4 games. Compare the mean scoring of each player.

 |
Outlier – Modeling Real
Life
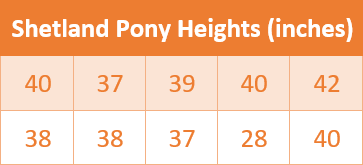
The table below shows the heights of several Shetland
ponies. Describe how the outlier affects the mean. Then use the data to answer
the statistical question, “What is the height of a typical Shetland Pony?”
 |
 |
Display the data in a dot plot to see the distribution of the data.
 |
The height of 28 inches is much less than the other heights.
So, it is an outlier. Find the mean with and without the outlier.
Mean with outlier:

Mean without outlier:

Let's practice.
An outlier is a value that is much higher or lower than
the other values in a data set. When calculating the mean of a data set with an
outlier, the outlier can significantly affect the value of the mean. Here's an
example problem to illustrate:
The scores of 10 students in a test are as follows: 80, 85, 90, 92, 88, 87, 86,
89, 91, and 10 (an outlier). What is the mean score of the students?
 |
 |
