WEATHER MAPS
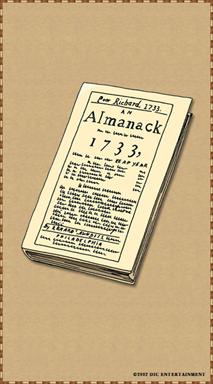
Predicting the weather is truly a challenge. Very early civilizations attributed control of the wind, rain and thunder to gods whose favor they needed to gain to take care of their crops and their need for water. Just a few thousand years ago, writings show that people attempted to use the positions of the stars as the basis for forecasting the weather. In the early history of our country, Benjamin Franklin created “Poor Richard’s Almanac” that used collected observations from farmers over the years of natural phenomenon like the behavior of animals and phases of the moon to serve as a general guide for weather forecasting. In the spring, farmers needed to know when the danger of frost was past so they could plant their crops. They again needed to know about the chance of frost in the fall so that tender crops could be saved and hardier crops like corn would dry out and then be harvested.
It is still important for farmers to have an accurate forecast of the weather for crop planting and harvesting, but urban populations are also subject to the wiles of the weather, especially severe weather like tornadoes, hurricanes and monsoons. Modern weather forecasting began with more sophisticated scientific instruments such as the thermometer and barometer. Observations of changes in temperature and pressure are crucial to accurate weather forecasting. Today, weather observers at stations all over the world record weather conditions.
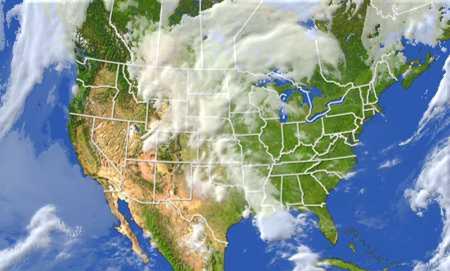
![]() Satellite Technology: Transforming
Meteorology (01:00)
Satellite Technology: Transforming
Meteorology (01:00)
The weather station observers record changes in barometric pressure and the speed and direction of surface winds. Even prior to man’s entering space, weather satellites were beaming back data from high altitudes to meteorologists who would combine it with lower atmospheric observations to predict the movement of weather systems around the world. They measure precipitation, record the air temperature and determine the humidity. They note the type, amount and height of the cloud cover, record visibility and general weather conditions. Local meteorologists download information from national and regional observation sites and combine that data with local observations to determine a forecast of 24 hours to five days in scope.
In order to predict the chance of rain or a hazy, hot and humid summer day, meteorologists prepare weather maps at the centers where coded weather information is received. These maps are constantly being updated as new data is received. Weather observations from the various stations reporting to the center are first translated into internationally recognized symbols. Clusters of symbols are plotted on the map around each reporting station, showing the conditions at that station. These symbols at the reporting station on a map are called a STATION MODEL. The common symbols that are used are illustrated in the following chart:
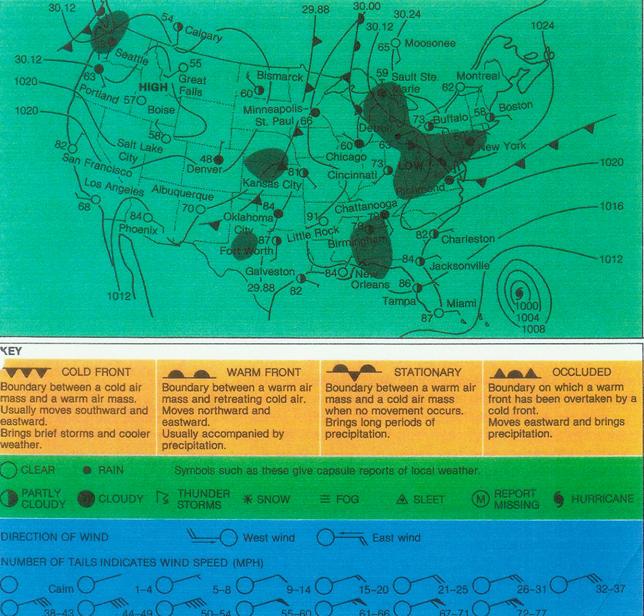
A typical weather map
Notice that the symbols for cloud cover, wind speed, and wind direction are combined into one symbol. One of the indicators included in the station model is the DEW POINT. The dew point is the temperature to which the air must be cooled to become saturated with water vapor. When the air is nearly saturated, there is a difference between its temperature and the dew point. A comparison of these is an indication of the RELATIVE HUMIDITY.
This station model also indicates the atmospheric pressure in MILLIBARS. The position of a straight line under this number shows whether the atmospheric pressure is steady, rising or falling.
You will notice on the weather map that lines have been drawn that connect points of equal atmospheric pressure. These are called ISOBARS. The spacing and shape of the isobars help meteorologists interpret their observations about the speed and direction of the wind. Closely spaced isobars indicate a rapid change in pressure and high wind speeds. Widely spaced isobars generally indicate a slow change in pressure and low wind speeds. Isobars that form circles indicate where there are centers of high (H) or low (L) pressure. For instance, closely spaced isobars that form concentric circles around a low pressure center represent a storm system.
The weather map is completed by marking in the location of fronts and areas of precipitation. FRONTS are definite boundaries of air masses of different temperatures. Fronts are indicated by changes in winds, temperature or humidity.
When meteorologists give the weather report, not only do
they show these weather maps and pinpoint information collected at these
stations, but now have the ability to show animated, computerized graphics to
illustrate how they are predicting a system will move through an area. Local DOPPLER RADAR SYSTEMS continuously feed
information to local meteorologists who may now pinpoint weather headed to a
particular location at a particular time. Continuous accurate forecasts can
usually be made for two to three days but, even with modern technology,
accuracy decreases with each additional day of forecast length.