POLYNOMIAL FUNCTIONS
In this unit, you will learn how to find rational zeros and zeros of polynomial functions. You will be introduced to the Remainder Theorem and the Factor Theorem and reintroduced to synthetic division of polynomials. It is necessary to have at least a TI-83 or TI-83 Plus calculator for this unit. As they become available, upgrades to these models are even better.
|
|
Graphs of Polynomial Functions
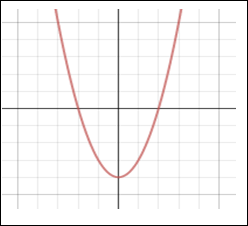
The degree of a polynomial function affects the shape of its graph. The graphs below show the general shapes of several polynomial functions. The graphs show the maximum number of times the graph of each type of polynomial may cross the x-axis. For example, a polynomial function of degree 4 may cross the x-axis a maximum of 4 times.
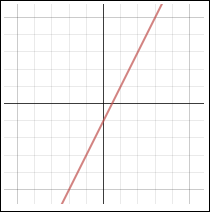
Linear Function Degree 1 |
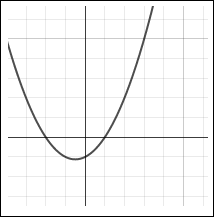
Quadratic Function Degree 2 |
|
 |
 |
|
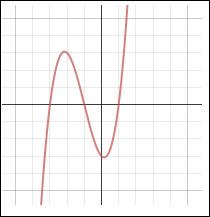
Cubic Function Degree 3 |
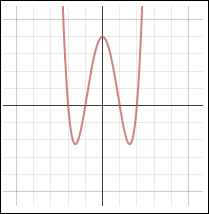
Quartic Function Degree 4 |
|
 |
 |
|
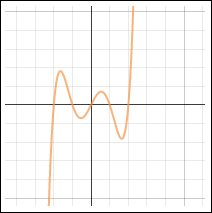
Quintic Function Degree 5 |
||
 |
||
Notice the general shapes of the graphs of odd degree polynomial functions and even degree polynomial functions.
|
|
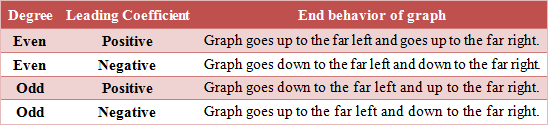
The chart below summarizes the end behavior of a Polynomial Function.
 |
| Example #1: Determine the end behavior of the graph of the polynomial function, y = –2x3 + 4x. The leading term is –2x3. Since the degree is odd and the coefficient is negative, the end behavior is up to the far left and down to the far right. Check by using a graphing calculator or click here to navigate to an online grapher. |
y = –2x3 + 4x |
 |
| Example #2: Determine the end behavior of the graph of the polynomial function, y = x4 + 3x3 + 2x2– 3x – 2. The leading term is 1x4. Since the degree is even and the coefficient is positive, the end behavior is up to the far left and up to the far right. Check by using a graphing calculator or click here to navigate to an online grapher. |
y = x4 + 3x3 + 2x2– 3x – 2 |
 |
| Example #3: Determine the end behavior of the graph of the polynomial function, y = –5x + 4 + 2x3. Rearrange the function so that the terms are in descending order. y = 2x3 – 5x + 4 The leading term is 2x3. Since the degree is odd and the coefficient is positive, the end behavior is down to the far left and up to the far right. Check by using a graphing calculator or click here to navigate to an online grapher. |
y = –5x + 4 + 2x3. |
 |
Now, let's practice determining the end behavior of the graphs of a polynomial.
Determine the end behavior of the graph of the polynomial function, y = –2x4+ 5x2– 3.
![]() What is the degree of the function? y = –2x4+ 5x2– 3
What is the degree of the function? y = –2x4+ 5x2– 3
The degree is 4.
"Click here" to check the answer.
![]() What is the leading term? y = –2x4+ 5x2– 3
What is the leading term? y = –2x4+ 5x2– 3
The leading term is –2x4.
"Click here" to check the answer.
![]() What is the end behavior of the function?
What is the end behavior of the function?
Since the degree is even and the coefficient is negative,
the end behavior is down to the far left and down to the far right.
"Click here" to check the answer.
The real roots or zeros are the x-values of the coordinates where the polynomial crosses the x-axis.
By examining the graph of a polynomial function, the following can be determined:
|
|
|
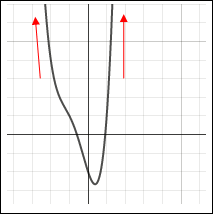
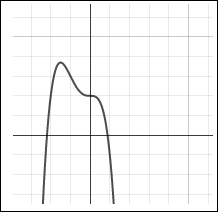
Example #4: For the graph, describe the end behavior, (a) determine if the leading coefficient is positive or negative and if the graph represents an odd or an even degree polynomial, and (b) state the number of real roots (zeros).
|
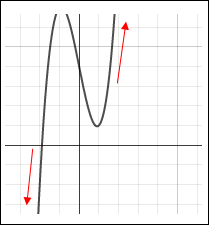
Example #5: For the graph, describe the end behavior, (a) determine if the leading coefficient is positive or negative and if the graph represents an odd or an even degree polynomial, and (b) state the number of real roots.
|
Now, let's practice examining a graph and determining the characteristics of its equation.
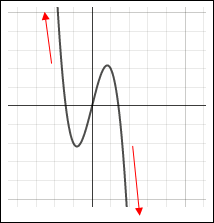
Examine this graph closely, and then answer the questions that follow about the equation of the graph.
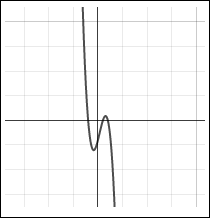 |
![]() Is the leading coefficient of the equation positive or negative and why?
Is the leading coefficient of the equation positive or negative and why?
Negative, because it is going up to the far left and down to the far right.
"Click here" to check the answer.
![]() Does the polynomial have an odd or even degree?
Does the polynomial have an odd or even degree?
Odd degree
"Click here" to check the answer.
![]() How can the leading coefficient and the degree of the polynomial be determined by looking at the graph?
How can the leading coefficient and the degree of the polynomial be determined by looking at the graph?
The end behavior of the graph is down for the far left and up for the far right.
"Click here" to check the answer.
![]() The equation has how many real roots (zeros)?
The equation has how many real roots (zeros)?
The graph crosses the x-axis at three points, thus, the function has three real zeros.
"Click here" to check the answer.
![]() Properties of Polynomial Graphs (10:42)
Properties of Polynomial Graphs (10:42)