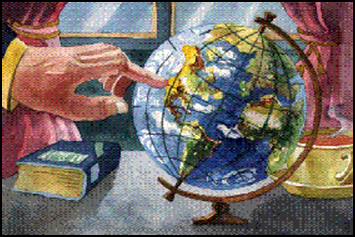
MODELS OF THE EARTH
Unit Overview
This
unit will look into the many tools developed by scientists to study our Earth.
These tools in turn, have brought about new discoveries and areas of research
in Earth science. Many technologies such as satellite global positioning
systems and topographic maps are
used by everyday people to make their lives comfortable and safe.
Unit
Directions
Read the following text on Earth
models, study the illustrations, complete all activities, and then answer the
test questions. Key terms will be in bold type.
|
GLOSSARY
OF KEY TERMS |
|
contour lines: imaginary lines that connect equal
areas of elevation on a topographic map |
|
globe: a map of the world or a celestial map
on a sphere, allowing for a more accurate representation of the Earth's
surface than can be shown on a flat map |
|
map: a flat, graphic representation of the
Earth |
|
model: a simplified description of a complex
entity or process |
|
oblate spheroid: a spherical shape that is a slightly
distorted sphere. The distortion occurs in the middle of the sphere where
there is a bulge |
|
pure science: the study of the natural world through
observation, identification, description, experimental investigation, and
theoretical explanations |
|
relief maps: maps having shading or color to
represent points of different elevation |
|
technology: the application of scientific advances
to benefit humanity |
|
thermodynamics: the study of the processes that involve
the transformation of heat from hotter bodies to cooler bodies |
|
topographic maps: maps that show natural and man-made
features of an area using contour lines (lines of equal elevation) to portray
the size, shape, and elevation of the features |
|
satellite: any
object, man-made or natural that orbits another object |
What shape is our
planet?
That sounds like a pretty
simple question, right? Most of us would quickly say, “Round.” But the Earth is
not perfectly round! It has an oblong shape like all the other planets. This is
caused by the spinning of the planets that forces the matter to compress in the
middle of the sphere-shaped planetary bodies, and a distortion in their shape
is created. Our Earth is almost a sphere, but not quite, so its shape is an oblate spheroid. Oblate describes the
oblong shape and spheroid tells us that the Earth is a nearly sphere-shaped
planet.
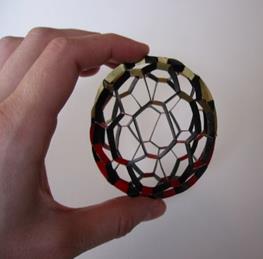
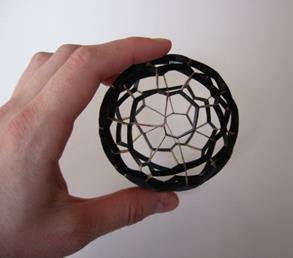
The first picture
shows an oblate spheroid from the
side. You can see that it is narrower at the top and bottom and wider in the
middle. The picture on the right shows a top view of the oblate spheroid. In this view, the shape looks perfectly round.
How did scientists
prove the oblate spheroid shape?
Scientists can not make a
statement about the Earth’s shape without evidence. So what is the evidence
that supports the oblate spheroid shape?
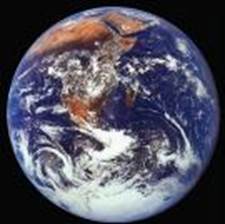
· Pictures from outer space: Astronauts and satellites have provided beautiful
photographs that help support the shape theory. It is, however, very hard to
detect by looking at photographs because the shape is so close to a perfect
sphere.
· Measurements: Accurate measurements are kept of the
movement of the stars and Sun. The movements of these heavenly bodies would
appear differently if the Earth were a perfect sphere. Another set of
measurements come from right here on Earth. Scientists collect calculations on
gravity’s affect on different objects. As an object moves away from the Earth’s
core, its weight changes. If the Earth were perfectly round, the weight of the
object would be the same all around the Earth as long as it was measured at the
same elevation. On Earth, objects weigh a little more at the poles and a little
less at the equator due to the oblate spheroid shape.
What types of models
are used to represent Earth?
· A model is
a visual representation, a mathematical equation, or a set of rules that let us
study an object or concept that is not easily observed. Many times a model is used when an object is too
large or too small to study and the model
aids in our understanding. For instance, we can not see a single skin cell with
the naked eye, so a scientist will use a poster or plaster model of the cell to study its parts and structure. The Earth is
too big for us to take in by just looking outside, so we invent physical models
to make observations much easier. The globe
is a familiar model used by many to
look at the complete structure of the Earth.
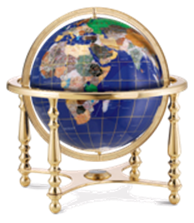
· People use globes for a variety of reasons. We can study
the continents of the world, the many bodies of water, latitudinal and
longitudinal lines, and political boundaries. A person can study the Earth as a
whole using a globe. The globe increases visual accuracy and
allows a viewer to create a mental map
and see the relationship between continents, oceans, and climatic differences.
Size, shape, distance and directions are accurately shown on a globe. Globes do not distort the major
features of our Earth.
Maps
· A map is a
flat, graphic representation of the Earth. Maps are drawn for a variety of
reasons. Most people are familiar with maps that are used to look up directions
for traveling from one place to another.
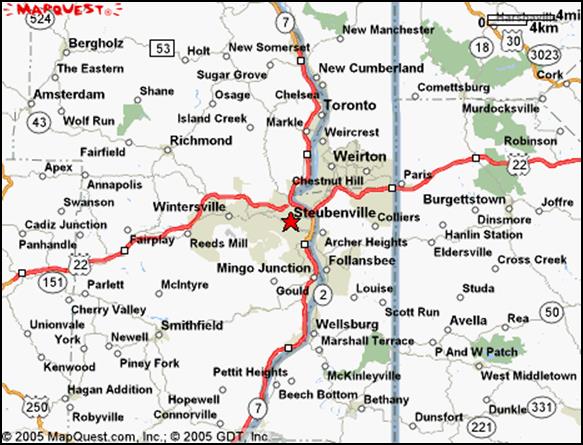
· The map above shows the area around Steubenville, Ohio. It displays major roads and the names of towns. The Ohio River is the blue winding line in the middle of the map. Other maps will give us different information.
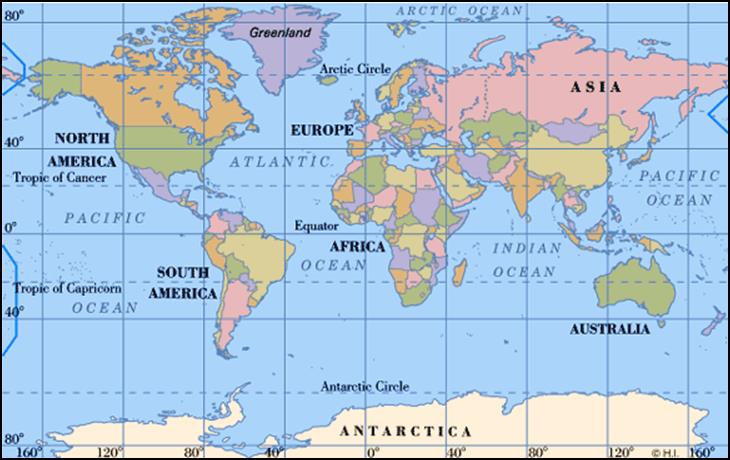
· World maps show the entire world at a glance. But
because a map is flat, there is
distortion in the size, shape and distance of features such as countries and
continents. The map above shows the
continents and oceans. Other world maps can show political boundaries
(countries), seismic activity, and weather patterns.
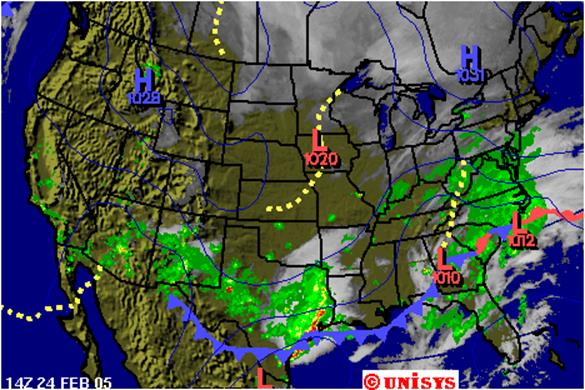
Weather maps detail information
that explains weather conditions across a specific area. These maps often come
with keys or special symbols that represent the various weather conditions.
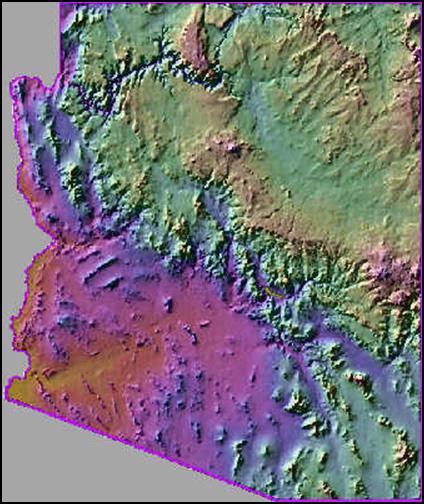
· Relief Maps are maps having shading or color to represent points
of different elevation. This type of map usually contains an explanation or key
to help a user read the map. The map below is a relief map of Arizona.
|
The colors indicate elevation above sea level · Orange and red areas in SW AZ are lowest · Blue and purple are higher · Green and brown areas in N and E AZ are even higher · The isolated pink color mountain areas are the highest. |
· Topographic
Maps are maps that show natural and
man-made features of an area using contour
lines (lines of equal elevation) to portray the size, shape, and elevation
of the features. Contour lines are
imaginary lines that connect equal areas of elevation. The contour lines make it possible for map users to measure the height
of mountains, the depth of bodies of water, and the slope of hills. Topographic maps usually have a key
that defines symbols representing other features such as wooded areas,
buildings, and streams.
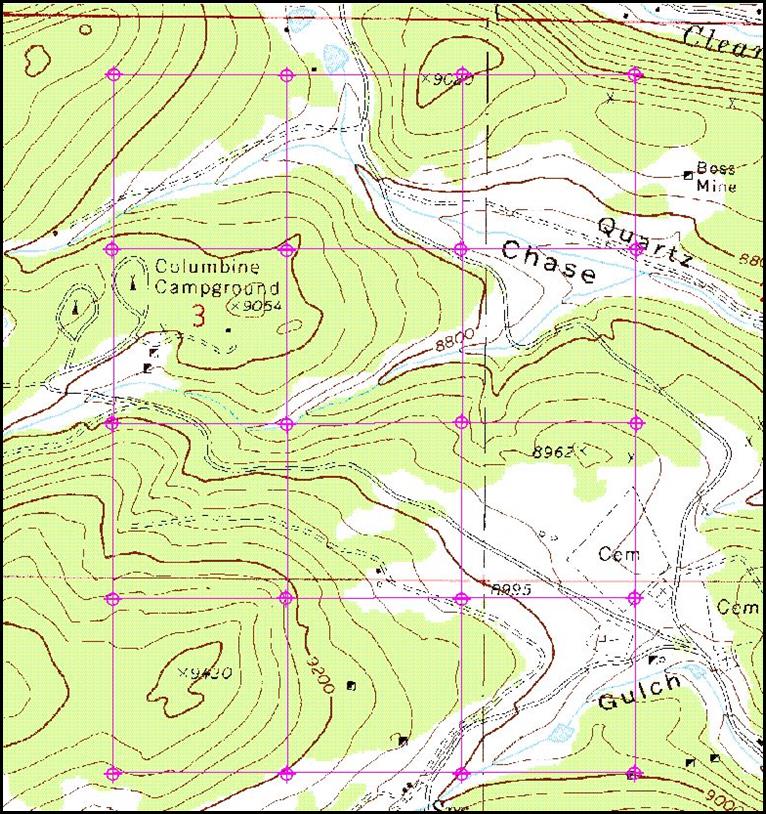
This is a Topographic Map of Vulture Peak in Arizona.
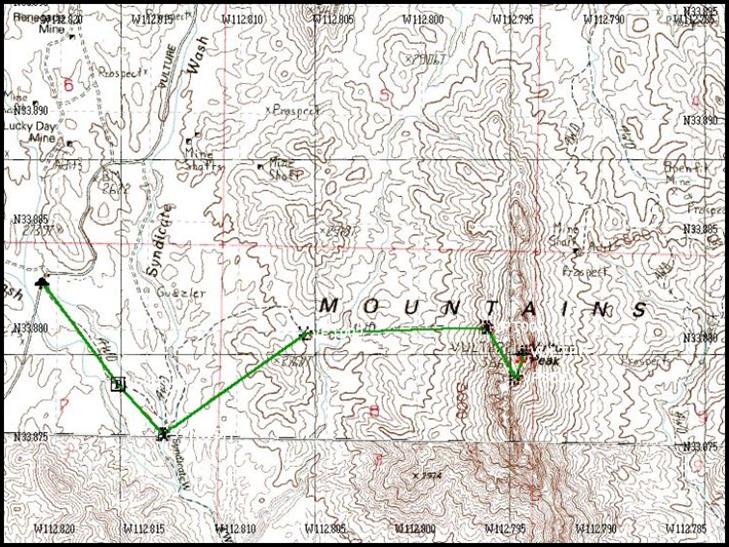
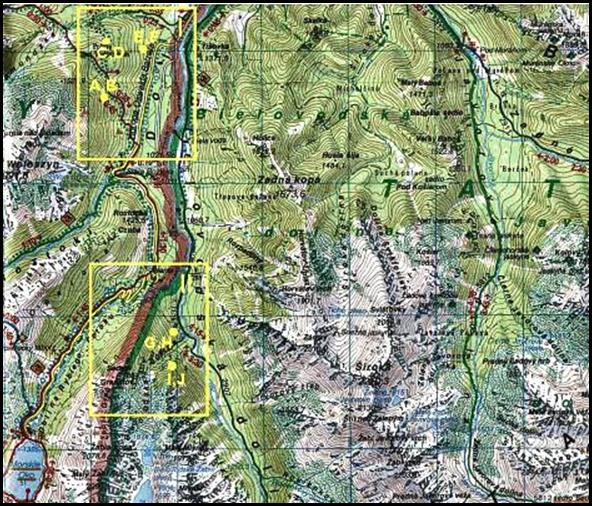
This topographic map is used by scientists
to record data to find relationships between bark beetle outbreaks in
Central Europe and site, host, environmental conditions (air pollution), and
spruce bark beetle populations.
Satellite Imaging
· A satellite
is any object, man-made or natural that orbits another object. Our moon is a
natural satellite of the Earth. But
did you know that there are over 8,000 artificial objects orbiting the Earth?
About 2,500 of these objects are man-made satellites, some of which currently
work and others that no longer work. The rest of the orbiting objects are
“space junk”, such things as rocket parts and pieces of metal that have broken
off of satellites. Man-made satellites perform many functions such as sending
and receiving weather data, military information, radio and television
transmission, and communication transmissions. Scientists use satellites to
collect a wide variety of information for research that helps us understand our
changing Earth.
· Geostationary Satellite Systems: These satellites
orbit the Earth at the same rate that the Earth rotates on its axis. This means
that the satellite keeps imaging the same area on Earth. These satellites orbit
around 35,785 km (22,235 miles) above the Earth and they can image almost half
of the sphere from that position.
· Space Stations and the Space shuttle: These vehicles perform a variety of functions. One of the functions is photography of the Earth. They send back photographs to scientists all over the world.
Earth’s Interior
Models
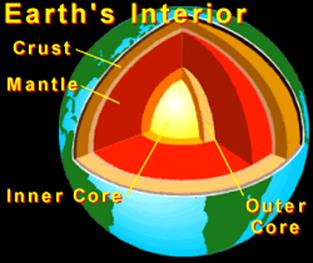
Scientists have collected data
for many years on the Earth’s movements. They have studied seismic activity
(earthquakes) and volcanic eruptions. All of this data helps scientists compose
a model of our Earth’s interior structure. No one has ever seen the interior of
the Earth, but theories supported by a great deal of evidence have lead
scientists to believe that the Earth’s interior looks like the picture below.
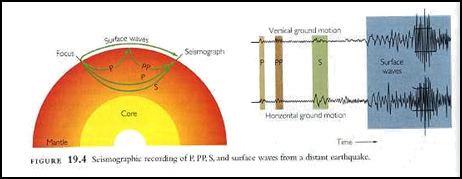
Scientists continually gather
information to improve the model of the Earth’s interior. They use measurements
of the speed that seismic waves move through the various compositions in the
Earth’s crust. Waves will travel at different speeds through solids than they
will through the molten layers. Scientist use these wave speeds to calculate
the depth of each layer of Earth.
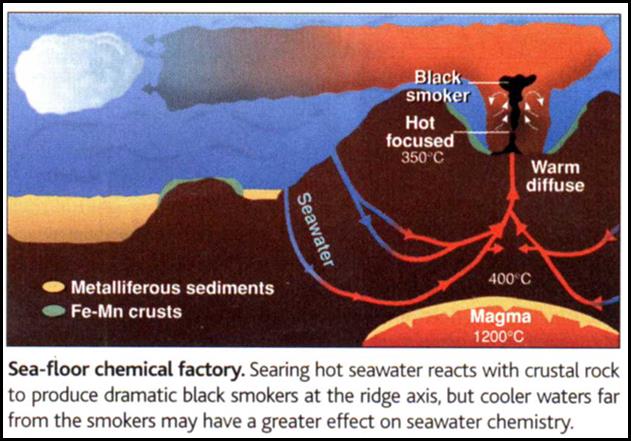
Scientists also use the thermodynamics of Earth to study its
interior. Thermodynamics is the
study of the processes that involve the transformation of heat into mechanical
work, of mechanical work into heat, or the flow of heat from a hotter body to a
colder body.
The Relationship
between Science and Technology
We have just finished a study
of how scientists composed theories and models of our Earth. Many observations
and experimental data have been put together to form the models. The study of
nature is advanced in two ways: pure
science and technology.
· Pure science is the study of the natural world through
observation, identification, description, experimental investigation, and
theoretical explanations. Scientists write books and research papers that
present the pure science to other
scientists. As scientists study nature, they invent many tools that in turn
help them collect more data. These tools are examples of technology.
· Technology is the application of scientific advances to benefit
humanity. As new technology is
invented, new information about nature helps us form new theories and models of
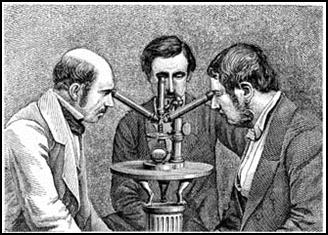
our world. For example, the microscope was invented after scientists put
together all they knew about refractive and reflective lenses, and the
magnification of objects. When they used the microscope, a great deal of new
information came about from observing objects closely and new discoveries were
made because some things were never seen by our naked eye.
Take
a few minutes to review this unit and then write down 3 examples of science and
3 examples of technology in the
unit.
